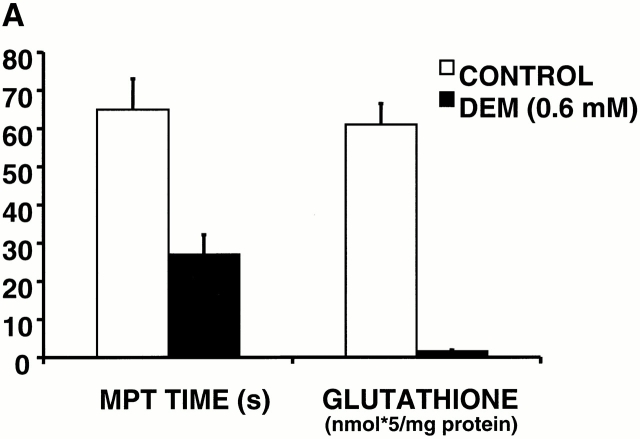
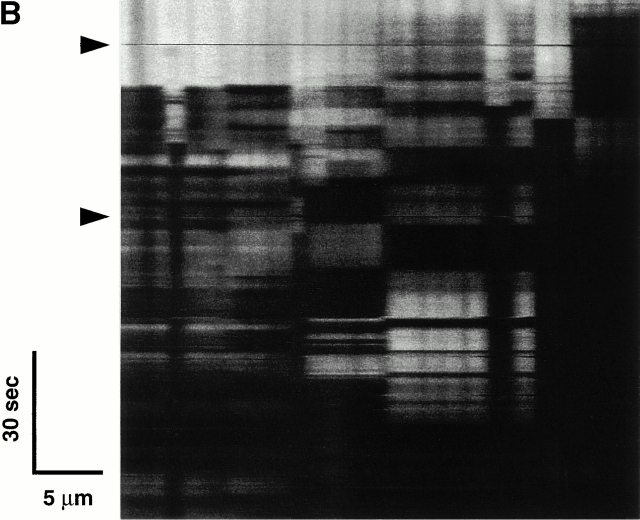
Figure 8.
Altered MPT characteristics after modulation of the redox state of soluble and protein thiols. (A) Comparison of MPT times (during 2 Hz line-scan imaging in TMRM-loaded cells) and cellular glutathione content in control versus 600 μM diethylmaleate-treated cells. (B) Development of apparent unstable MPT pore flickering during 2 Hz line-scan imaging in a representative TMRM-loaded (125 nM) cell exposed to 5 mM diethylmaleate. Arrows indicate movement artifacts.


