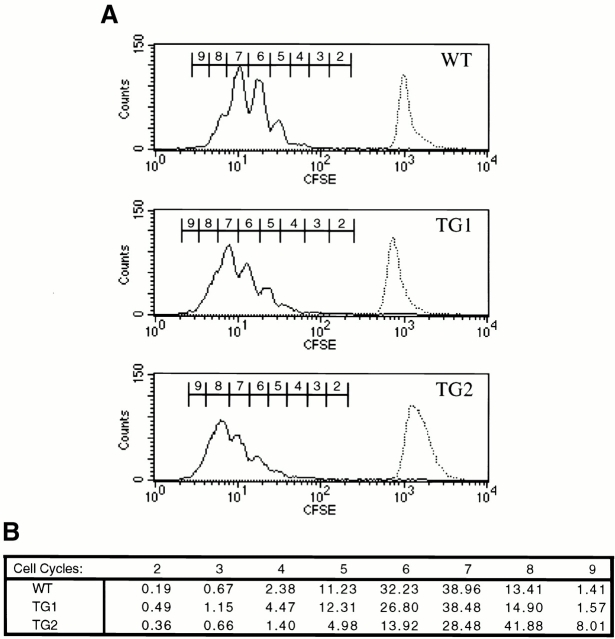
Figure 3.
IFN-γ signaling does not affect the mitotic profile of Th1-polarized cultures. (A) CFSE-labeled, purified CD4+ splenocytes from WT, TG1, and TG2 mice (top, middle, and bottom, respectively) were cultivated on anti-CD3 plus anti-CD28–coated plates and Th1 polarized with anti–IL-4 mAbs and IL-12. 4 d after the initiation of the culture, cells were analyzed by flow cytometry for CFSE fluorescence gating on live CD4+ cells. The sequential dilution of intracellular fluorescein, depicted as peak progression from right to left, represents progressive cell division. The CFSE label intensity at the initiation of each culture is represented as a dashed histogram overlaid at the right of each panel. (B) A chart numerically representing the percentages of cells in each peak of the histograms in A. Results are representative of three independent experiments.

