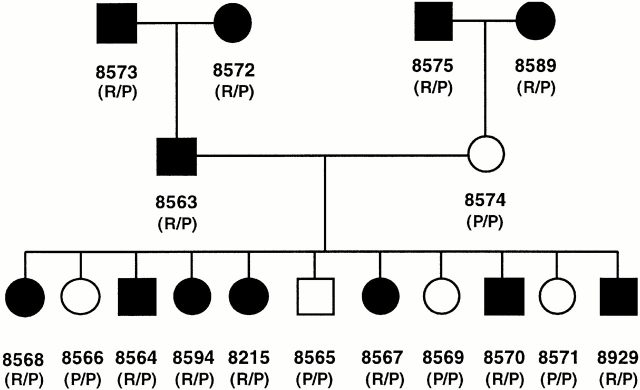
Figure 5.
HA-8 mHAg allelic segregation analysis. Segregation of the HA-8R and HA-8P alleles and correlation of the HA-8R allele with cytolysis by SKH-13 CTLs at an E/T ratio of 5:1 is shown using the BLCL of CEPH reference family 1362. Filled circles (females) or squares (males) indicate strong lysis by SKH-13 CTLs (phenotype positive); open symbols indicate minimal lysis (phenotype negative). Numbers below symbols were assigned to each family member by the University of Utah. R/P represents HA-8R/P heterozygous genotype; P/P represents HA-8P genotype (the HA-8P/liter polymorphism cannot be distinguished by these genotyping PCR primers). Genotyping of HA-8 mHAg alleles was determined by PCR-RFLP of genomic DNA as described in Materials and Methods.

