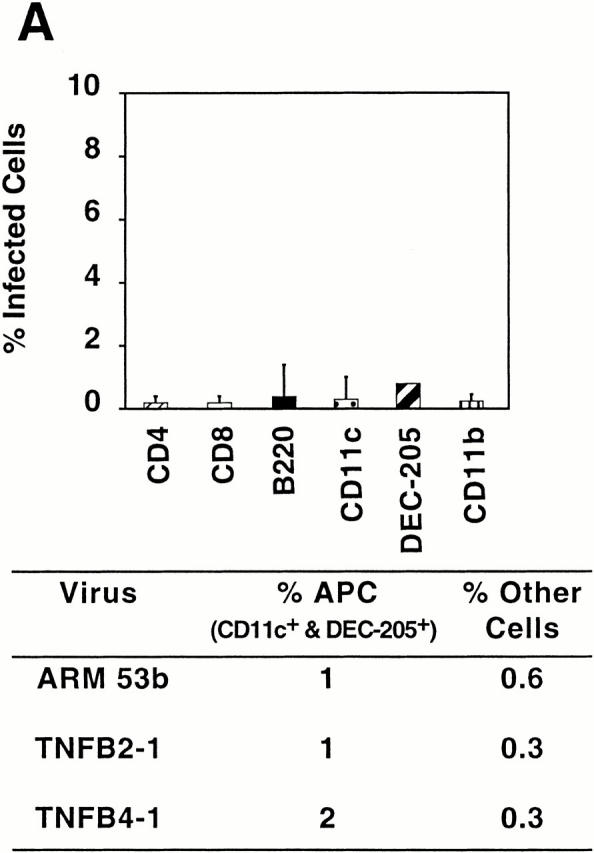
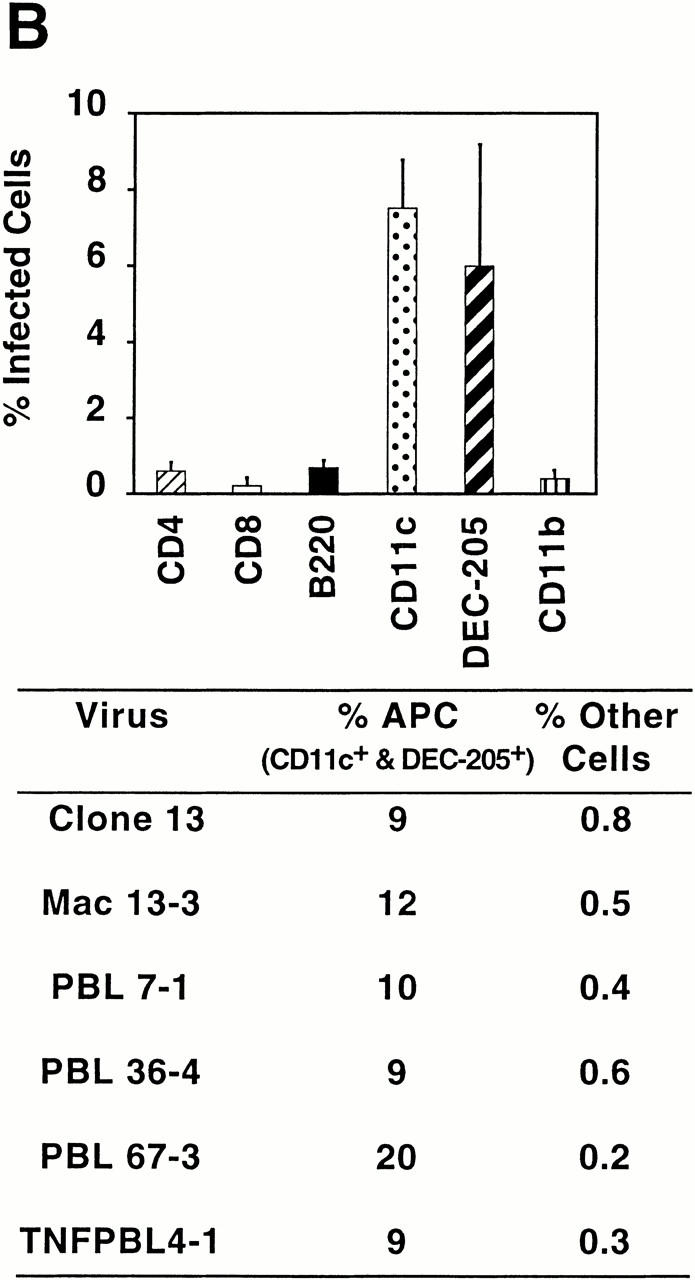
Figure 3.
Comparative levels of infectivity in immune cells caused by CTL−P+ and CTL+P− viral variants. In each experiment, four adult BALB/c ByJ mice were injected intravenously with 2 × 10⁶ PFU of virus, and 3 d after infection a pooled splenocyte suspension was prepared from each mouse (see Materials and Methods). Each cell population was labeled with cell-specific monoclonal antibodies to CD4, CD8, B220, CD11c, DEC-205, and CD11b. Subsequent intracellular staining using specific antibody to LCMV NP (antibody 113) was performed, followed by FACS®. The graph represents percentages of cells in each subset infected with ARM 53b (A) or Cl 13 (B). Summarized below are the percentages of infected antigen-presenting cells (CD11c, CD11b, B220, and DEC-205+ cells) or CD4 and CD8 T cells infected with these viruses. The term “other cells” refers to the sum of percentages for infected CD11b+, B220+, CD4+, and CD8+ T cells. (A) Infection of cell populations by CTL+P− viruses. (B) Infection of cell populations by CTL−P+ viruses.