
Figure 5.
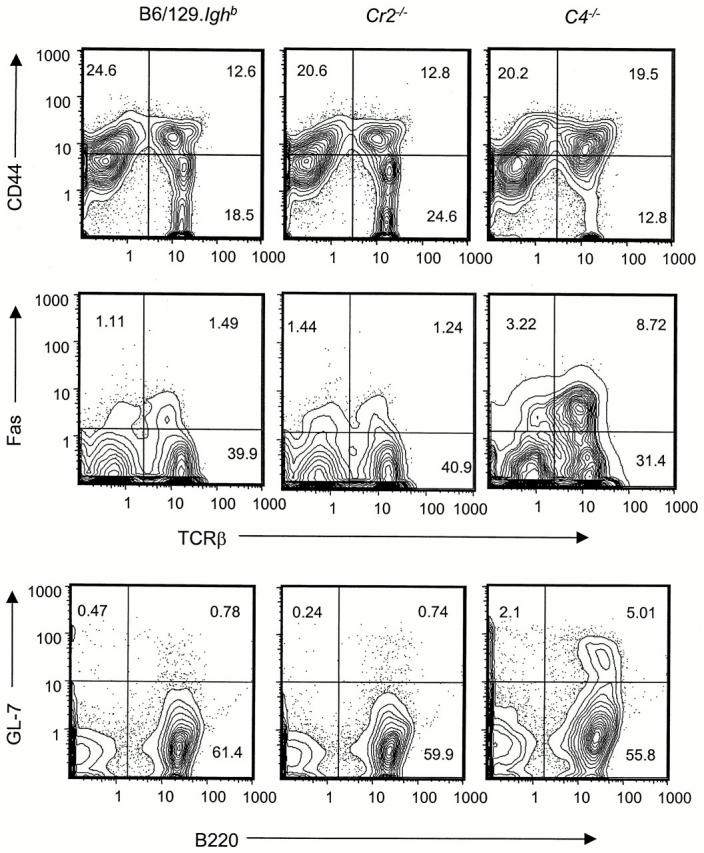
Increased frequencies of activated T and B cells in spleens of C4 − /− mice. Splenocytes from 10-mo-old female B6/129.Ighb (left), Cr2 − /− (center), and C4 − /− (right) mice were analyzed by flow cytometry. Profiles are generated from a gate for live lymphocytes and are representative of four to five mice in each group (see Table ).