
Figure 6.
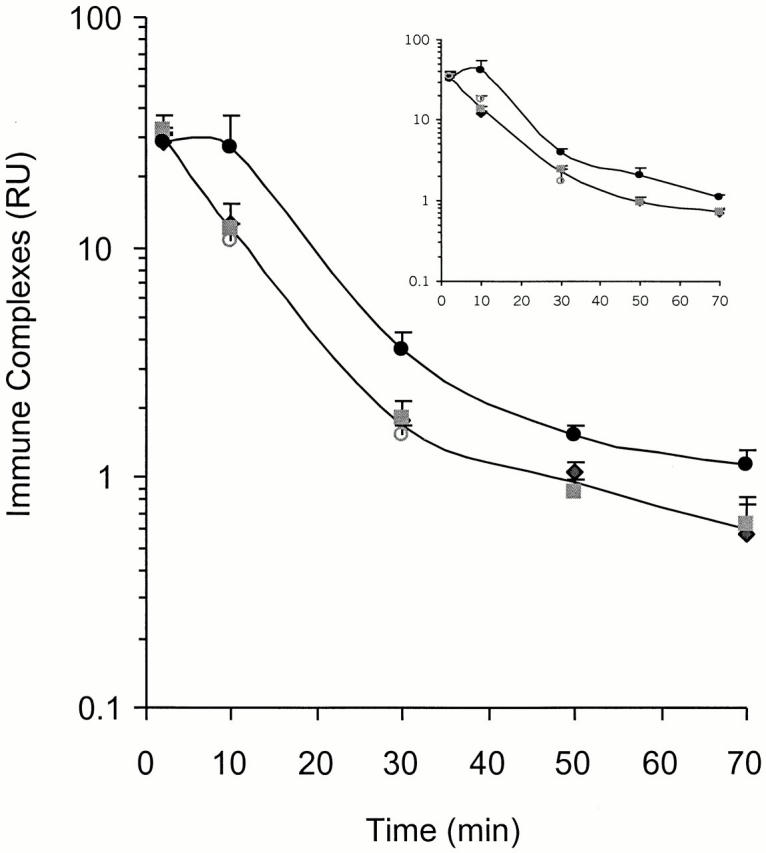
Impaired clearance of ICs in C4 − /− mice. Cohorts of B6/129.Ighb (♦), Cr2 − /− (▪), C4 +/− (○), and C4 − /− (•) mice were each injected with 100 RU of ICs through tail veins and bled from orbital sinus at 2, 10, 30, 50, or 70 min after IC injection. IC levels in plasma were assessed by ELISA. Data in the figure were determined with a goat anti–mouse IgG2b detector antibody; inset data were determined with goat anti–mouse Igλ. Upper curves represent the kinetics of IC clearance in C4 − /− mice, and lower curves are average clearance rates by B6/129.Ighb, C4 +/−, and Cr2 − /− mice; these values do not differ significantly from each other (P > 0.05; Student's t test). Individual clearance curves for B6/129.Ighb, C4 +/−, and Cr2 − /− mice are not shown, but IC RU (mean ± SEM) values for each group are presented; each point represents two to six mice. At the time points of 10, 30, 50, and 70 min, IC levels in C4 − /− animals differ significantly from B6.Ighb mice (P < 0.05, Student's t test).