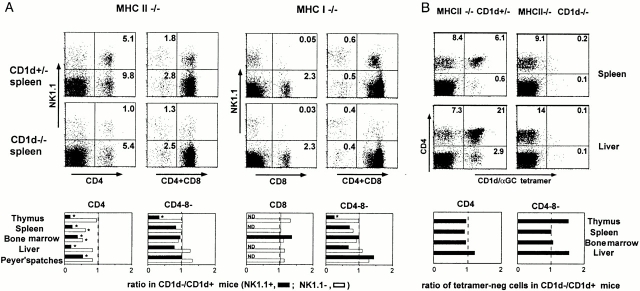
Figure 1.
Residual αβ T cell subsets in MHC-versus MHC/CD1d–deficient mice. (A) NK1.1+ and NK1.1− subsets. FACS® dot plots represent the TCR-β1 gated splenocytes from MHC class II– and MHC class I–deficient mice stained with antibodies against NK1.1, CD4, and/or CD8. In the bar graphs, bars represent the average ratio of the numbers of each cell type in CD1d−/− mice versus CD1d+/− littermates (5–14 littermate pairs per data point). MHC class I−/− mice were either KbDb−/− or TAP−/−; results with KbDb−/− mice (shown in the FACS® dot plots) and TAP−/− mice (summarized in the bar graphs) were similar. Error bars are not shown for graphic clarity. ND, not detected (frequency <0.05%). *Statistically significant (P < 0.05). (B) CD1d/αGalCer+ and CD1d/αGalCer− subsets. The FACS® dot plots show the CD4 and CD1d/αGalCer tetramer profiles of TCR-β1 gated cells from MHC class II−/−CD1d+/− and MHC class II−/−CD1d−/− littermates, as indicated. The bar graphs represent the average ratio of the numbers of CD1d/αGalCer− cells in CD1d−/− mice versus CD1d+/− littermates (four to eight littermate pairs per data point).

