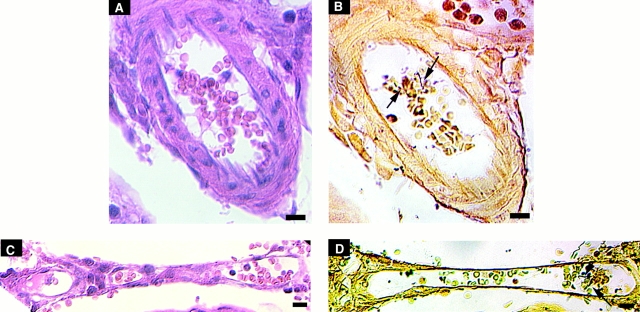
Figure 5.
Localization of microemboli during B. crocidurae infection. Each row represents the same part of a section stained with eosin (A and C) or with modified silver staining (B and D). The top row is 3 d after inoculation, the bottom row 5 d after inoculation. In A and B, erythrocyte rosettes can be seen in a small artery, whereas in C and D erythrocyte rosettes can be seen in a postcapillary venule. Arrows point to spirochetes. Bars = 10 μm.

