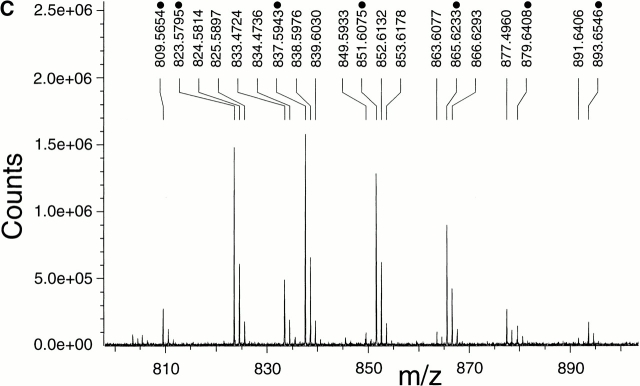
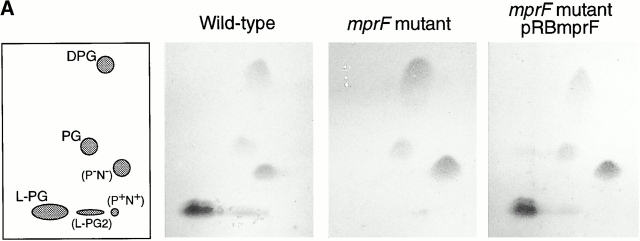
Figure 4.
Detection of membrane lipids (A), structure (B), and mass spectrometry analysis (C) of L-PG. (A) The polar lipids from S. aureus Sa113 wild type, mprF mutant, and mutant complemented with pRBmprF were analyzed by 2d-TLC. The first panel shows the position of the lipids DPG, PG, L-PG, and the putative 2′ L-PG isomer (L-PG2). Two unidentified lipids were negative (P−N−) or positive (P+N+) with both phosphate- or amino group–specific reagents, respectively. (B) Structure of L-PG. (C) Part of the FT-ICR mass spectrogram of the TLC spot lacking in the mprF mutant. The molecular masses of singly protonated ions (m/z) are given above the peaks. The major peaks represent L-PG species with two saturated fatty acids (indicated with a dot; compare Table ). The minor peaks represent species with one unsaturated fatty acid (mass difference of −2) or molecules containing one or two 13C atoms (mass differences of +1 or +2).


