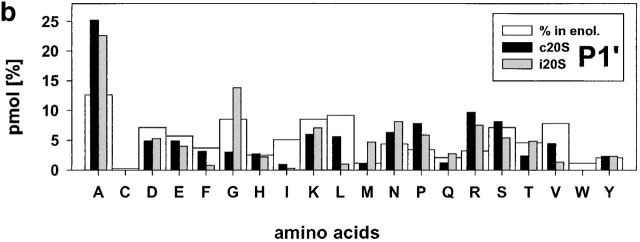
Figure 3.
Relative frequencies of amino acids in position P1 (a) P1′ (b). The absolute amount of amino acids found in a defined positions (P6 to P6′) around cleavage sites used by constitutive proteasomes and immuoproteasomes was divided by the total amount of peptides detected in the digests resulting in the relative frequency of amino acid usage in that position. Big white bars, relative frequency of amino acids found in enolase; black bars, relative frequency of amino acids at P1 or P1′ positions in peptide fragments generated by constitutive proteasomes; grey bars, relative frequency of amino acids at P1 or P1′ in peptide fragments generated by immunoproteasomes.


