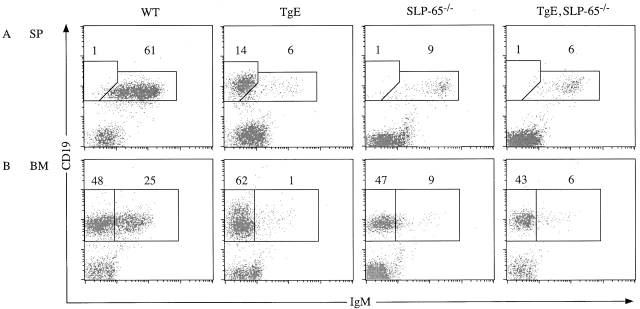
Figure 1.
Loss of the LMP2A developmental and survival phenotype when bred into the SLP-65−/− background. (A) Mouse splenocytes (SP) and (B) bone marrow samples (BM) from WT, TgE SLP-65−/−, and TgE SLP-65−/− animals were subjected to flow cytometric analysis with at least 10,000 gated lymphocytes collected per animal using CD19-PE (CD19) and IgM-FITC (IgM) antibodies. Typical dot plot results of 10,000 gated lymphocytes from 5–7-wk-old animals (n = 5) are shown. The polygons represent distinct subpopulations of B cells with the average percentage of total gated lymphocytes indicated above each polygon. (A) The left polygon represents CD19+IgM− B cells typical in TgE animals; the right polygon represents CD19+IgM+ cells. (B) The left rectangle represents CD19+IgM− B cells; the right rectangle represents CD19+IgM+ B cells.

