
Figure 1.
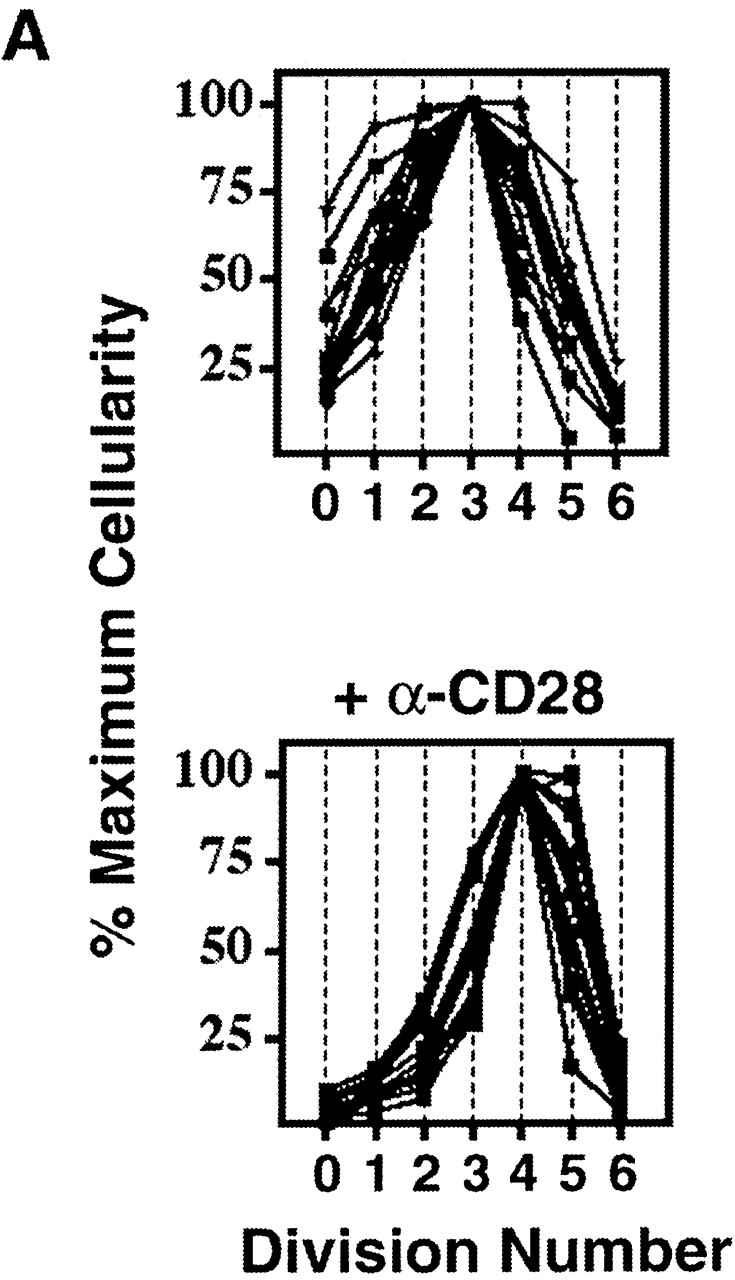

Uniformity in the clonal expansion of CD4+ T cells. (A) CD8-depleted, CFSE-labeled splenocytes were stimulated (see Materials and Methods) with varying concentrations of anti-CD3 mAb (0.05–5.0 μg/ml), and analyzed on day 3, 4, 5 or 6 (top panel). Cellularity of live, CD4+ cells, as determined by specific staining with anti-CD4 mAb, in relation to cell division number is depicted graphically. For comparative purposes the number of cells in each cell division as determined by CFSE dilution (x-axis) was expressed as a percentage of the number of cells in the cell division having the largest number of cells (y-axis) within each experimental condition. Top panel includes 10 experiments (with each line representing one experimental condition and time point). Bottom panel depicts 10 experiments (with each line representing one experimental condition and time point) using varying concentrations of both anti-CD3 (0.01–2.0 μg/ml) and anti-CD28 (0.3–10.0 μg/ml) mAbs, all analyzed on day 4. Cells from both C57BL/6 and BALB/c mice were tested. Dose responses of anti-CD3 and anti-CD28 were tested at least twice. (B) CD8-depleted, CFSE-labeled splenocytes were stimulated with anti-CD3 mAb (1.0 μg/ml), anti-CD28 mAb (2.0 μg/ml), and rIL-2 (2 U/ml) for 3 d, and stained with fluorochrome-conjugated Annexin V and anti-CD4 mAb. Binding of Annexin V (“% Apoptotic,” y-axis) among CD4+ cells of indicated division number (x-axis) is depicted in bar graph (left panel), and flow cytometric data of CD4+ events is displayed (right panel) as cell division (x-axis) versus Annexin V binding (y-axis). Polygonal gate indicates upper limit of background fluorescence. Results are representative of four separate experiments.