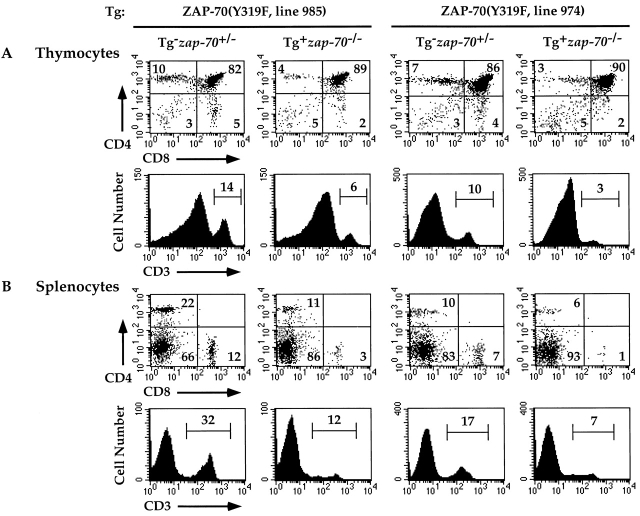
Figure 4.
Attenuated development of T cells in zap-70 −/ − mice expressing ZAP-70(Y319F). Thymocytes (A) and splenocytes (B) isolated from ZAP-70(Y319F)+ zap-70 −/ − mice were analyzed for CD4 and CD8 (top) and CD3 (bottom) expression. Representative profiles of two independent transgenic lines (985 and 974) are shown. Average thymocyte number isolated for each genotype is represented in Table .

