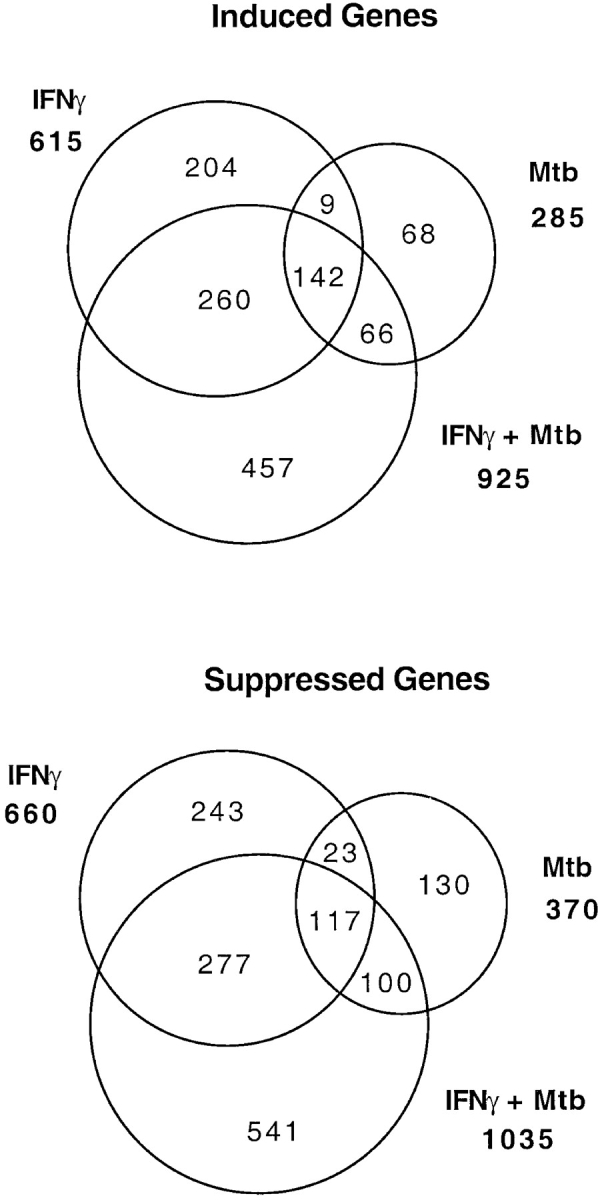
Figure 3.

Extensive gene regulation in wt macrophages by IFN-γ and Mtb: extent of synergy. Numbers in bold face to the sides of the Venn diagrams report the total number of genes induced or suppressed (P ≤ 0.05) by IFN-γ, Mtb, or their combination. Numbers within the sectors tally the genes regulated uniquely or in common by these stimuli. The largest subsets of regulated genes were those that were only induced or suppressed by IFN-γ and Mtb acting synergistically. Instances in which IFN-γ and Mtb had opposite effects are omitted for clarity.
