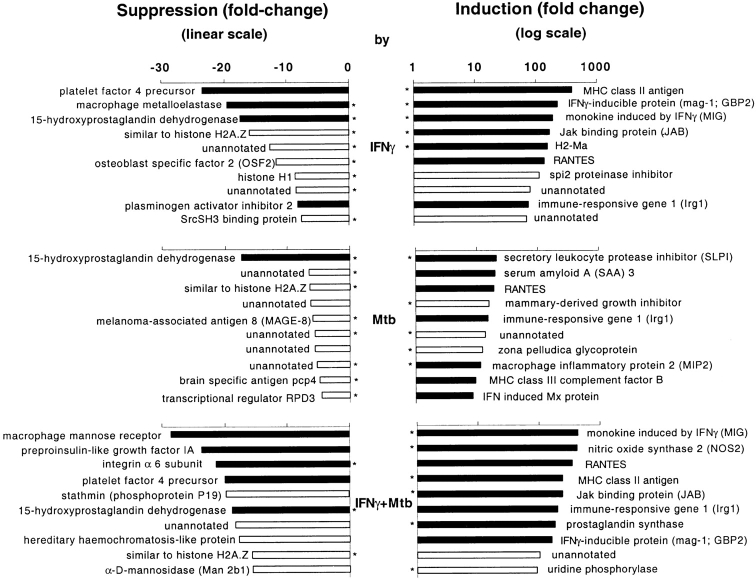
Figure 5.
Ten most highly induced and suppressed genes in wt macrophages responding to IFN-γ, Mtb, or both. Genes directly related to inflammation and immunity are depicted by black bars, others by white bars. Suppression (fold change <1) is represented as the negative inverse on a linear scale, while induction is shown on a log scale. Probe sets with one value (baseline or treated) in the noise are starred. Online supplemental material (http://arrays.rockefeller. edu/murtb/) supplies Genbank accession numbers.

