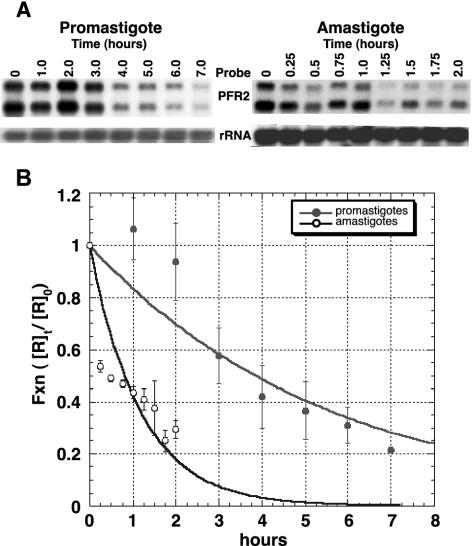
FIG. 1.
Stability of PFR2 mRNA in promastigotes and amastigotes. Promastigotes and amastigotes were treated with actinomycin D (10 μg/ml) for the time indicated. Amastigotes received additional actinomycin D at 1 h. The zero time point was taken just prior to the addition of actinomycin D. Five micrograms of total RNA from each time point was fractionated, blotted, and probed with in vitro-synthesized RNA from pPFR2 as described in the text. (A) Representative Northern blots for the promastigote and amastigote time courses. The signals for the the PFR2 and rRNA probes are displayed. (B) PFR transcript abundance was quantitated by using a phosphorimager and was normalized to the small subunit of rRNA to control for loading. For each time point, the normalized values for PFR2 mRNA ([R]t) were divided by the normalized time zero value ([R]0) to obtain a value for the fraction of PFR2 mRNA remaining ([R]t/[R]0) which was plotted against time, in hours. The plotted data were fitted to the exponential decay expression: [R]t/[R]0 = e−kt, where k is a rate constant, t is time in hours, and e is the inverse natural log. For the promastigote data, k is 0.18 h−1; for amastigotes, k is 0.86 h−1. Values for the half-life were calculated by setting [R]t/[R]0 at 0.5 and solving for t. Each data point is the average for three independent experiments. Error bars show standard deviations.

