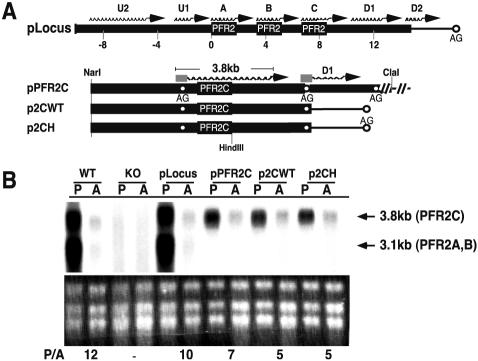
FIG. 2.
Episomal expression of PFR2 genes recapitulates wild-type regulation in the Δpfr2 background. (A) Schematic representation of various constructs used in stable-transfection experiments. Thick lines represent Leishmania sequences, and thin lines represent sequences from the vector itself. U1 and U2 are upstream transcripts; D1 and D2 are downstream transcripts relative to the PFR2 genes. Wavy lines at the top of the genes represent the position of mRNA synthesized from respective constructs. Open circles denote the position of the splice acceptor sites (AG). The splice acceptor sites for the PFR2C transcript and the D1 transcript are indicated under the position of the respective mRNA. A rectangular box at the 5′ end of the transcript denotes the miniexon. (B) Northern analysis of total RNA from promastigotes (P) and amastigotes (A) of wild-type L. mexicana (WT), the Δpfr2 strain (KO), and the Δpfr2 strain containing the indicated plasmids probed with PFR2 coding sequence as described in the text. Ethidium bromide-stained rRNA is shown below the autoradiogram. Numbers below rRNA are the ratio of PFR2 mRNA in promastigotes to that in amastigotes (P/A). This ratio was generated using PFR2 mRNA levels determined by using a phosphorimager and then normalizing to ethidium bromide-stained rRNA quantified by densitometry.

