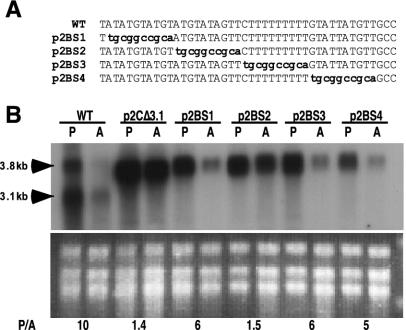
FIG. 6.
Block substitution analysis of PFR2C 3′ UTR containing the putative regulatory region. (A) Position of the 10-nt substitution sequences, shown in lowercase, in each of the four block substitution constructs made as described in the text. (B) Northern analysis of total RNA from promastigotes (P) and amastigotes (A) of the wild type (WT) and the Δpfr2 line containing the indicated plasmids probed with PFR2 coding sequence. Ethidium bromide-stained rRNA is shown below the autoradiogram. Numbers below the rRNA are ratios of PFR2 mRNA in promastigotes to that in amastigotes (P/A), determined as described in the legend to Fig. 2B.

