
Figure 6.
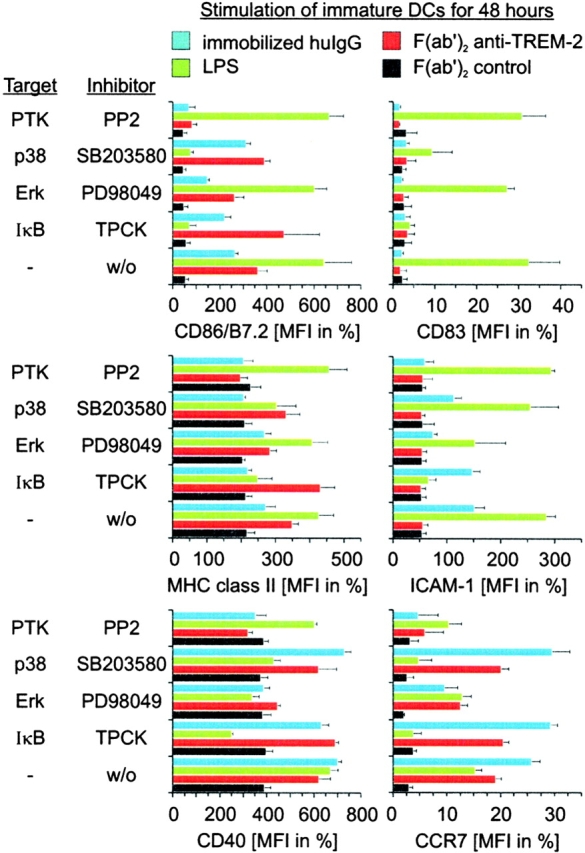
Comparison of TREM-2-, LPS/TLR-, and FcR-mediated maturation pathways. Monocyte-derived DCs were stimulated with plastic-bound control F(ab′)2 (black bars), F(ab′)2 anti–TREM-2 (red bars), human IgG (blue bars), or LPS (green bars) in the presence of inhibitors for Erk (PD98059), p38/SAPK (SB203580), PTK (PP2), IκBα degradation (TPCK), or an equal volume of DMSO as a control. After 48 h, cell surface expression of CD86 (top left panel), MHC class II (middle left panel), CD40 (bottom left panel), CD83 (top right panel), ICAM-1 (middle right panel), or CCR7 (bottom right panel) was determined by flow cytometry. Data shown are representative of four independent experiments and display the mean and standard deviation of three independent samples.