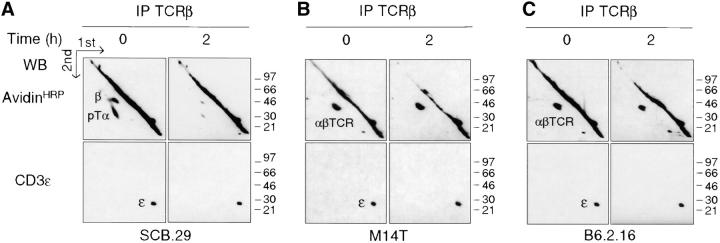
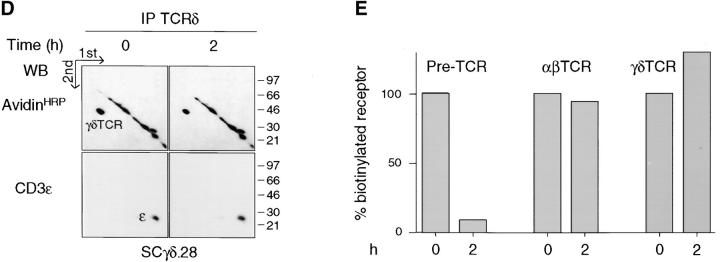
Figure 3.
Limited stability of the pre-TCR in the plasma membrane. (A–D) Immunoprecipitation with the indicated antibody of the cell line defined at the bottom of each quadrant. Cells were labeled at the surface with biotin, lysed in 1% Brij 96, and immunoprecipitates were resolved by two-dimensional nonreduced versus reduced SDS-PAGE. Western blots with avidin-HRP and CD3ε antibodies on stripped membranes of immunoprecipitations performed immediately after labeling (0) and a 2-h chase in culture (2) are shown. IP, immunoprecipitation; WB, Western blots. (E) Densitometric analysis of the displayed experiment (the mean of the values obtained with the two cell lines is plotted for αβTCR).


