
Figure 4.
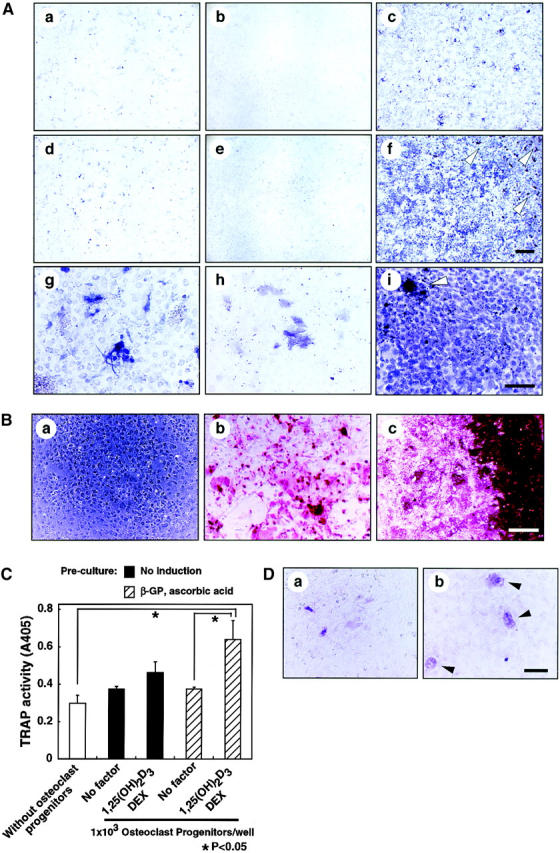

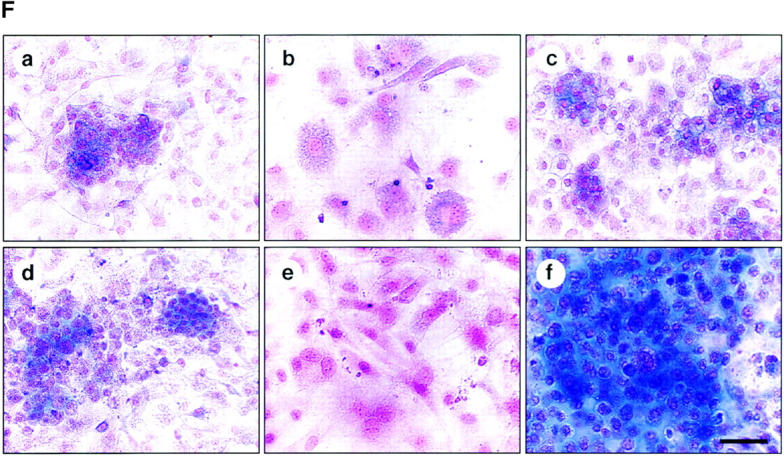
Osteoblasts, adipocytes, and chondrocyte differentiation. (A) Total LMCs (a, d, and g), ALCAMlow/− cells (b, e, and h), and ALCAMhigh cells (c, f, and i) were induced (d–i) or not-induced (a–c) to undergo osteogenic differentiation. After 2 wk, ALP staining was performed. Panels g–i show high power fields of d–f, respectively. Scale bars, 1 mm (a–f), 200 μm (g–i). (B) The region of alizarin red positive calcium deposition in ALCAMhigh cells, in which osteogenic differentiation was induced for 2 wk. (a) no factor; (b and c) β-GP and ascorbic acid. (b) The center of culture plate. (c) The corner of the culture plate. (C) TRAP activities were measured on day 7 of cocultivation of BM derived osteoclast precursor cells and ALCAMhigh cells, which were induced (hatched bar) or not induced (solid bar) to undergo osteogenic differentiation in the presence or absence of 1,25-(OH)2D3 and Dex. The data shown represents the mean ±SD. (D) Results of TRAP staining of cocultured BM-derived osteoclast precursor cells and ALCAMhigh cells, in which osteogenic differentiation was induced. TRAP-positive multinucleated cells are indicated by arrowheads. (a) no factor; (b) in the presence of 1,25-(OH)2D3 and Dex. Scale bar, 100 μm. (E) Total LMCs (a and d) ALCAMlow/− cells (b and e), and ALCAMhigh cells (c and f) were induced to undergo adipogenic differentiation (as described in Materials and Methods) and stained with Nile red. (a–c) control medium; (d–f) MDI medium. Scale bar, 200 μm. (F) Alcian blue staining after chondrogenic induction. Total LMCs (a and d), ALCAMlow/− cells (b and e), and ALCAMhigh cells (c and f) were induced to undergo chondrogenic differentiation as described in Materials and Methods. (a–c) no factor; (d–f) in the presence of BMP-2. Scale bar, 100 μm.