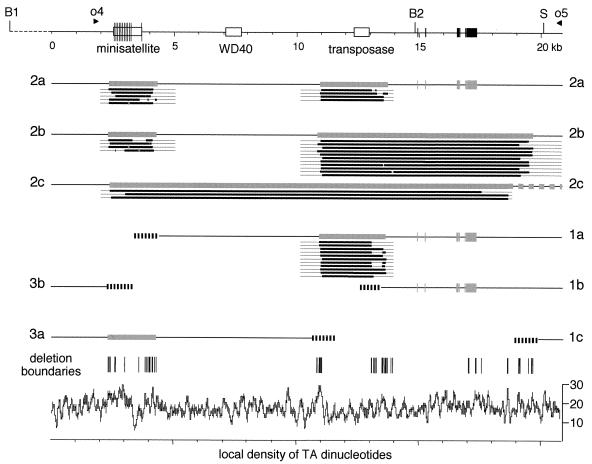
FIG. 5.
Maps of main alternative rearrangements. The major macronuclear versions are represented by labeled lines (2a, 2b, 2c, 1a, and so forth) below the map of the germ line sequence (top line). Gray boxes in the macronuclear versions show the approximate positions of imprecise internal deletions of the minisatellite and truncated Tennessee copy, as determined by mass PCR mapping. The right end of the large deletion in version 2c is uncertain, as indicated by the disconnected gray boxes. Thick black lines below gray boxes indicate the exact extents of the deletions in individual molecules sequenced from cloned PCR products; thin lines on both sides show the regions covered by the PCRs. The six invariant IESs are shown as black boxes in the germ line sequence; gray boxes in the macronuclear versions indicate the positions of the corresponding precise deletions of the IESs. Hatched regions at the ends of fragmented chromosomes 1 and 3 represent telomere addition regions. The graph at the bottom shows the local density of TA dinucleotides along the germ line sequence (percentage of total dinucleotides computed in a 100-bp window); the short vertical lines above the graph mark the positions of the boundaries of internal deletions for all sequenced molecules (excluding the IESs).

