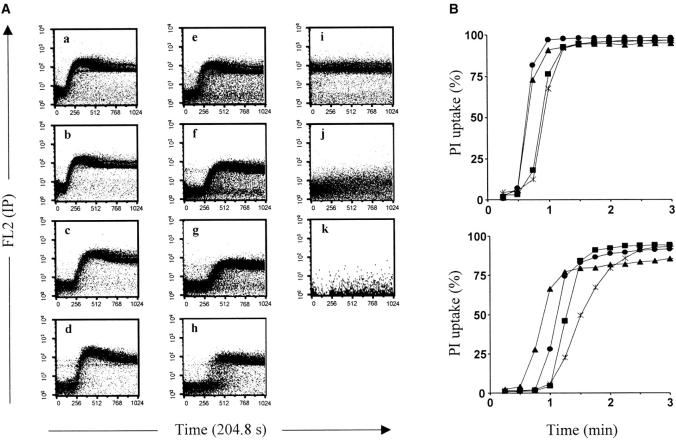
Figure 3.
Real-time kinetics of Leishmania promastigote lysis in NHS. Promastigotes were taken from log phase and early stationary phase growth cultures, and the course of parasite lysis measured in 50% NHS as described (Materials and Methods). (A) FL2 against time dot plots of log phase (a–d), and stationary phase (e–h) promastigote PI uptake in 50% NHS, as well as controls (i–k). L. major (a and e); L. amazonensis (b and f); L. donovani (c and g); L. infantum (d and h); maximum PI uptake control (i); background PI uptake control in EDTA-NHS (j); and nonspecific NHS fluorescence (k). (B) Promastigote PI uptake kinetics derived from dot plot data. Top panel: log phase promastigotes. Lower panel: early stationary phase promastigotes. L. major (▴); L. amazonensis (•); L. donovani (▪); L. infantum (*).

