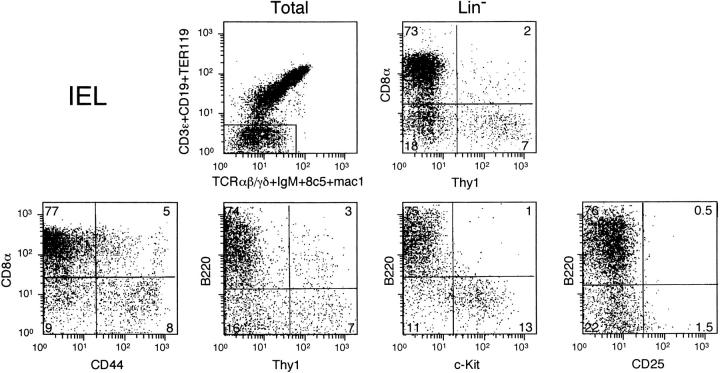
Figure 2.
The phenotype of Lin− IEL. The upper-left graph shows the total lymphoid population and the window used to select Lin− cells. The upper-right graph shows Thy1/CD8α expression in Lin− IEL. The lower graphs show Lin− cells labeled with anti-CD8 and/or anti-Thy1 Abs, together with other markers.

