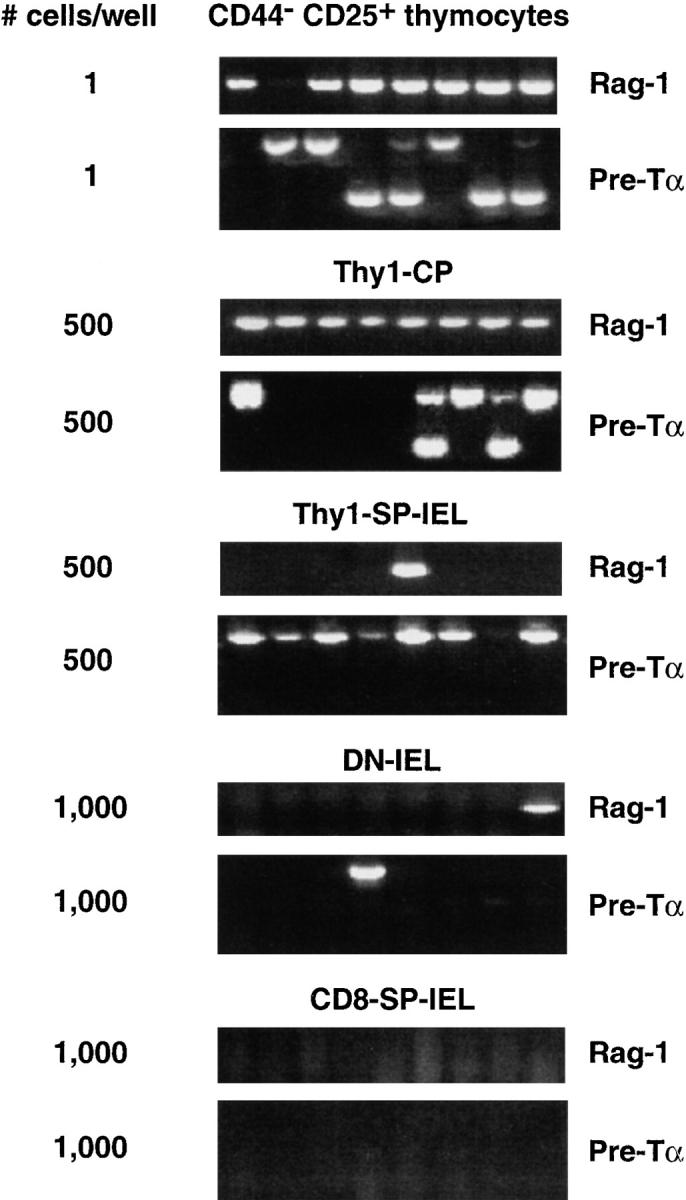
Figure 4.

Results show a few examples of the RT-PCRs performed to quantify the expression of Rag-1 and pre-Tα mRNAs in thymus and gut precursors. All wells were positive for HPRT expression. These images illustrate a much higher expression of these genes in the thymus (where most individual cells express these genes) than in the gut (many wells containing 500 or 1,000 cells were negative). They also show that Lin− subpopulations express genes at different frequency: Rag-1 mRNA expression is much higher in CP (all wells containing 500 cells were positive) than in IEL. Maximal expression of pre-Tα is found in Thy1-SP IEL (all wells containing 500 cells were positive). We scored 320 Thy1-SP IEL cells expressing pre-Tα and only found the long form of pre-Tα, whereas both thymocytes and Thy1-CP cells express both forms. Please note that results of the quantification of gene expression (obtained from all RT-PCR data) are only shown in Tables I and II.
