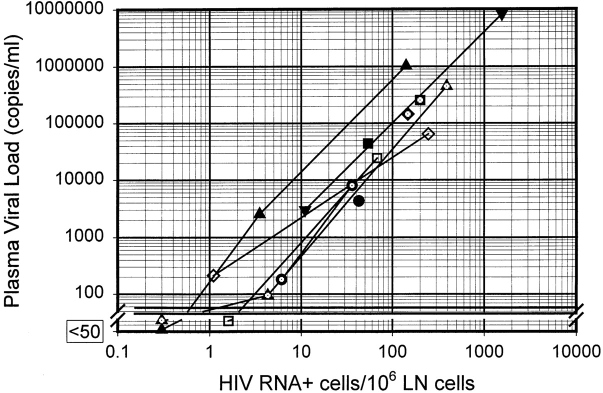
Figure 4.
Relationship of plasma viral load to HIV vRNA–expressing cells in lymph node tissue. Each point represents a separate biopsy specimen paired with the plasma viral load at time of biopsy. HIV vRNA+ cells were measured by ISH, and plasma viral loads were determined by the Roche Monitor® ultra-sensitive assay. The lines connecting points with the same symbols represent the same patient before and after HAART, as shown in Table I. Overall regression line (using the log-transformed data) of these data: slope = 1.6; r = 0.95 (P < 10−8).

