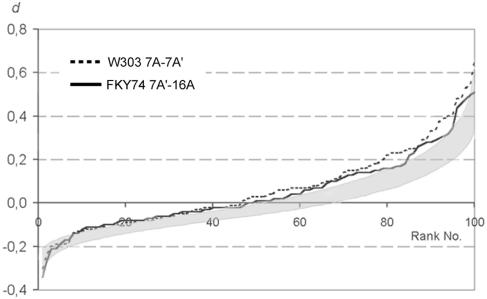
FIG. 5.
Examples of two experiments (experiments 12 and 13 in Table 2) in which the values for d (solid and broken lines, respectively) show a slight deviation from simulated d (shaded area depicting the 90% confidence interval), which suggests a preference for homologous loci to be adjacent.

