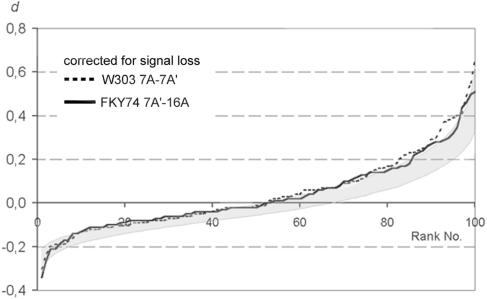
FIG. 8.
d values for the two experiments 12 and 13 (Table 2 and Fig. 5) after correction for 10% FISH signal loss. The corrected experimental data give a better fit with the simulated random distribution and show a better overlap with the area occupied by 90% of runs of the simulation (shaded area).

