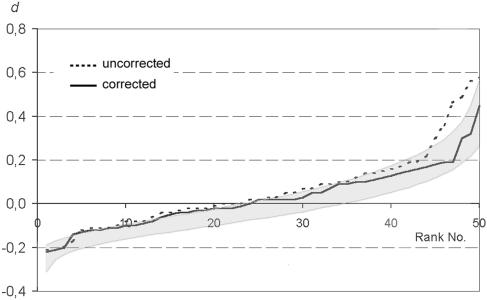
FIG. 9.
Experimental data (dotted curve) from measurements of three-dimensional distances between loci 7A and 16A (experiment 32 in Table 2). If 10% signal loss is taken into account, the corrected experimental data give a better fit with the simulated random distribution and produce a curve (solid) that is almost entirely within the area occupied by 90% of runs of the simulation of random relative positioning in three dimensions (shaded area).

