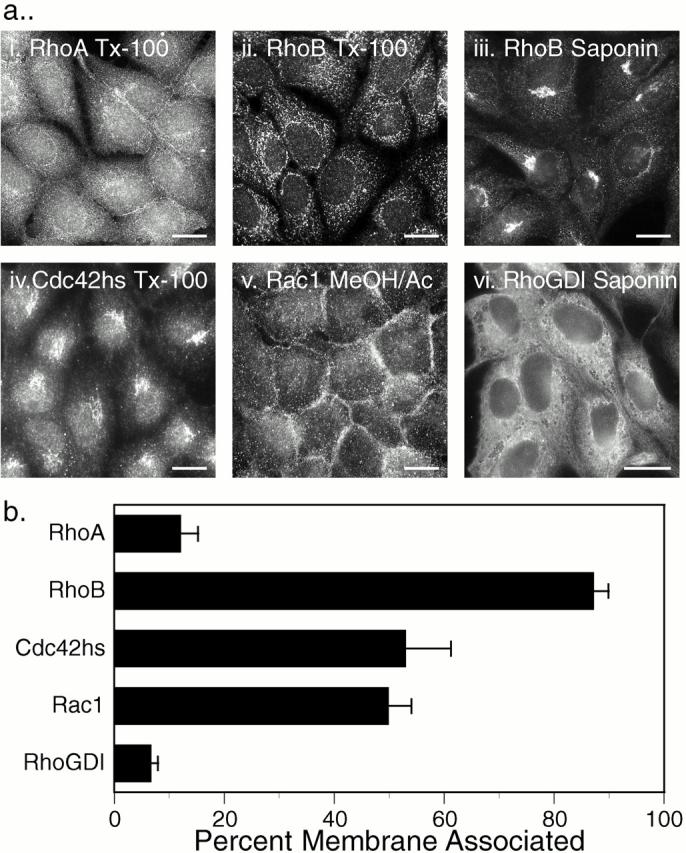
Figure 5.

Localization of endogenous Rho GTPases and RhoGDI. (a) Indirect immunofluorescence: untransfected MDCK cells were grown on coverslips, fixed with 3% paraformaldehyde (i–iv, and vi) or ice-cold methanol/acetone (1:1; v), permeabilized with Triton X-100 (i, ii, and iv) or saponin (iii and vi), and stained for the indicated protein as described in Materials and Methods. (b) Subcellular fractionation: COS-1 cell cytosolic and membrane fractions were analyzed by immunoblot for the indicated proteins, and relative amounts were quantitated by a PhosphorImager. Results are expressed as the percentage of the endogenous protein detected in the membrane fraction and are given as mean ± SEM (n = 8). Bars, 10 μm.
