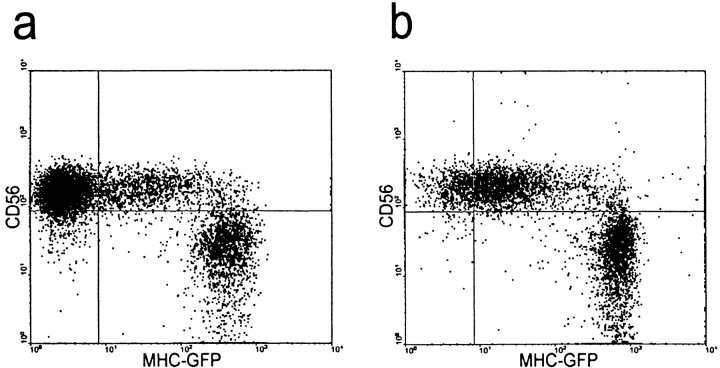
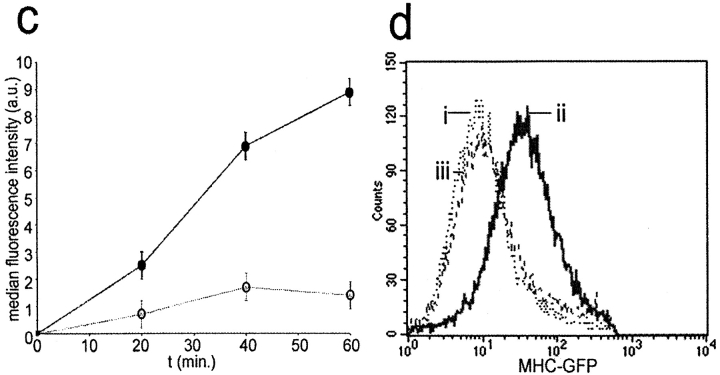
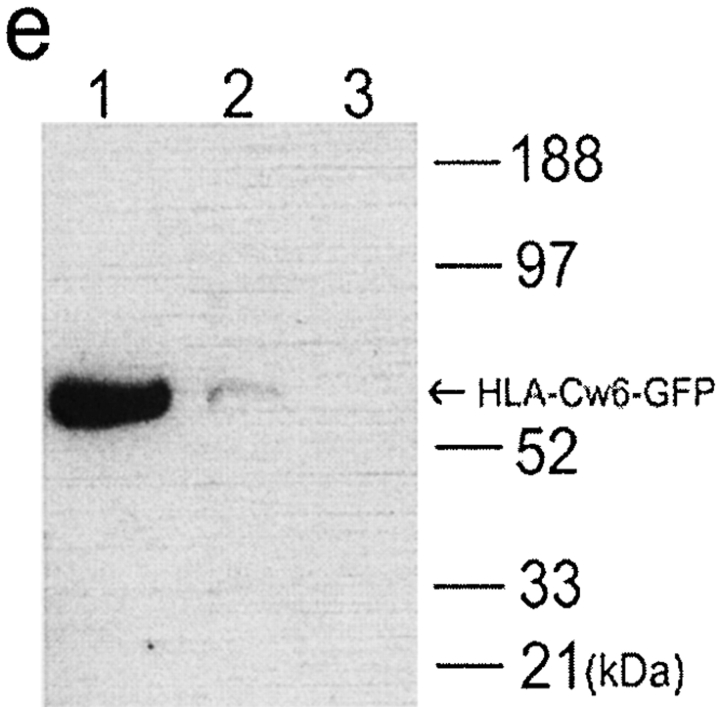
Figure 2.
Transfer of HLA-Cw6 transfer between populations of NK and target cells analyzed by flow cytometry. YTS/KIR2DL1 cells were incubated with either (a) 221/Cw3-GFP or (b) 221/Cw6-GFP for 1 h and subsequently fixed, stained for CD56, and analyzed by flow cytometry. Plots show level of CD56 expression (y-axis) against the level of GFP fluorescence (x-axis). CD56+ YTS/KIR2DL1 cells incubated with 221/Cw6-GFP targets have brighter GFP fluorescence compared with those incubated with 221/Cw3-GFP. (c) YTS/KIR2DL1 cells were incubated for 0, 20, 40, and 60 min with 221/Cw6-GFP or 221/Cw3-GFP targets. HLA-Cw6-GFP levels within purified YTS/KIR2DL1 populations were assessed by flow cytometry. Closed circles represent YTS/KIR2DL1 cells that were incubated with 221/Cw6-GFP targets and the open circles represent those incubated with 221/Cw3-GFP. Increasing median fluorescence intensity over time was observed in the case of YTS/KIR2DL1 cells incubated with 221/Cw6-GFP targets compared with those incubated with 221/Cw3-GFP. Data are representative of three separate experiments. (d) YTS/KIR2DL1 cells were incubated with either (i) 221/Cw3-GFP, (ii) 221/Cw6-GFP, or (iii) YTS/Eco with 221/Cw6-GFP for 1 h and subsequently fixed, stained for CD56, sorted by FACS®, and analyzed by flow cytometry. Plot shows number of cells (y-axis) against the level of GFP fluorescence (x-axis). CD56+ YTS/KIR2DL1 cells incubated with 221/Cw6-GFP targets have brighter GFP fluorescence compared with those incubated with 221/Cw3-GFP or compared with YTS/Eco incubated with 221/Cw6-GFP. (e) YTS/KIR2DL1 preincubated with both 221/Cw6-GFP and 221/Cw3-GFP were isolated by FACS®, lysed, and the total protein analyzed by SDS-PAGE followed by Western blot analysis with anti-GFP mAb. Lane 1 contains 221/Cw6-GFP cell lysate to indicate the size of HLA-Cw6-GFP. Lanes 2 and 3 are YTS/KIR2DL1 preincubated with 221/Cw6-GFP and 221/Cw3-GFP, respectively. Blot shown is representative of three independent experiments.


