Abstract
To study the adaptation of natural killer (NK) cells to their major histocompatibility complex (MHC) class I environment we have established a novel mouse model with mosaic expression of H-2Dd using a Cre/loxP system. In these mice, we noticed that NK cells expressing the inhibitory receptor for Dd, Ly49A, were specifically underrepresented among cells with low Dd levels. That was due to the acquisition of Dd molecules by the Ly49A+ NK cells that have lost their Dd transgene. The uptake of H-2D molecules via the Ly49A receptor was restricted to strong ligands of Ly49A. Surprisingly, when Ly49A+ NK cells were Dd+, uptake of the alternative ligand Dk was not detectable. Similarly, one anti-Ly49A mAb (A1) bound inefficiently when Ly49A was expressed on Dd+ NK cells. Concomitantly, functional assays demonstrated a reduced capacity of Ly49A to inhibit H-2bDd as compared with H-2b NK cells, rendering Ly49A+ NK cells in Dd+ mice particularly reactive. Minor reductions of Dd levels and/or increases of activating ligands on environmental cells may thus suffice to abrogate Ly49A-mediated NK cell inhibition. The mechanistic explanation for all these phenomena is likely the partial masking of Ly49A by Dd on the same cell via a lateral binding site in the H-2Dd molecule.
Keywords: ligand uptake, NK cells, Ly49A, H-2D, Cre/loxP
Introduction
NK cells are lymphocytes capable of killing various tumor and virally infected target cells and produce cytokines (in particular IFN-γ) and chemokines (1). An inverse correlation exists between the expression levels of MHC class I molecules on potential target cells and their susceptibility to NK cell–mediated lysis, a pattern termed missing self-recognition (2). Normal levels of MHC class I molecules expressed by normal cells prevent lysis by autologous NK cells. Reduced expression or loss of MHC class I molecules and/or increased expression of ligands for activating NK cell receptors, which can occur upon malignant transformation or viral infection, will abrogate NK cell inhibition and lead to target cell lysis (3–5).
NK cells express inhibitory receptors that preclude NK cell reactivity upon recognition of MHC class I molecules on target cells. In the mouse, inhibitory receptors specific for MHC class Ia molecules belong to the Ly49 receptor family (for review, see references 6 and 7). Some of these C-type lectin-like receptors are able to discriminate polymorphic MHC class Ia molecules. For example, the inhibitory Ly49A receptor interacts strongly with class I molecules such as H-2Dd (Dd) and Dk, but only very weakly with Db (8–10). The selectivity of some Ly49 receptors together with their combinatorial distribution allows NK cells to react to subtle changes in a cell's MHC make up, such as the absence of a single class I allele (11).
The MHC class I environment in which NK cells arise influences their reactivity to target cells. NK cells do not reject syngeneic bone marrow grafts, e.g., H-2b mice accept H-2b grafts. However, upon the expression of a Dd transgene (Tg)*in H-2b mice, NK cells acquire the capacity to reject bone marrow grafts from H-2b donors, while they are unreactive to syngeneic H-2bDd grafts (12, 13). NK cells adapt to the presence of the Tg Dd molecule, acquiring tolerance toward MHC-identical (Dd+) cells and reactivity to cells that lack Dd, a pattern we have termed missing Dd-reactivity. Self-tolerance of H-2bDd Ly49A+ NK cells is indeed ensured via the inhibitory effect of Ly49A. In contrast, the analysis of H-2b Ly49A+ NK cells revealed that self-tolerance was independent of Ly49A function. (14–16).
The cellular and molecular basis for the NK cells adaptation to their MHC class I environment is still not well understood. To study these processes we have engineered a genetic “off-switch” for Dd using an inducible Cre/loxP system (13). Dd Tg mice were generated using a genomic Dd clone, which is flanked by loxP sites. The loxP sites can be recognized by Cre recombinase, leading to the deletion of the flanked sequence and consequently shutdown of Dd expression. These Dd Tg mice were crossed to mice harboring a Cre Tg that is under the control of the IFN-α responsive Mx promoter (17). Lymphocytes in Dd × MxCre double Tg mice displayed variable Dd levels even without deliberate Cre induction (13). In these and other mice with mosaic expression of a Dd Tg, i.e., where in individual mice H-2bDd and H-2b cells coexist, NK cells failed to appropriately acquire missing-Dd reactivity (13, 18). Missing-Dd reactivity in Dd single Tg mice is performed by Ly49A-expressing NK cells (14). In the Dd mosaic situation these cells failed to acquire missing-Dd reactivity (13).
To explore the basis for the differential behavior of Ly49A+ NK cells we have compared the Ly49A+ NK cell subsets of B6 (H-2b), Dd single (H-2bDd), and Dd × MxCre double Tg mice. During these analyses we have noticed that in Dd × MxCre double Tg mice only very few Ly49A+ NK cells were devoid of Dd. We show that this is due to an ability of the Ly49A NK cell receptor to acquire Dd molecules from environmental Dd-expressing cells. Interestingly, however, H-2 ligand expression by Ly49A+ NK cells prevented ligand uptake from environmental cells. Further experiments suggested that the Ly49A receptor in Dd+ mice is poorly accessible and concomitantly that the capacity of Ly49A to signal NK cell inhibition is drastically reduced. These findings and their implications for NK cell function are discussed in the context of the recent resolution of the crystallographic structure of the Ly49A/H-2Dd complex (19).
Materials and Methods
Mice.
C57BL/6 (B6) (CD45.2, H-2b), B10.D2 (H-2d), and B10.BR (H-2k) mice were purchased from Harlan OLAC. Congenic B6 CD45.1 and β2-microglobulin (β2m)-deficient B6 mice were purchased from The Jackson Laboratory. Ly49A Tg mice were described previously (20). Floxed Dd Tg mice, backcrossed to B6 mice, were described elsewhere (13). Mx1-Cre Tg mice were provided by M. Aguet, Institut Swisse De Recherche Experimentale Sur Le Cancer, Epalinges, Switzerland (17). All mice were older than 6 wk when used for experiments.
Cre expression was induced by intraperitoneal injection of the IFN-inducer polyinosinic-polycytidylic acid (polyI/C; Sigma-Aldrich). Mice received 250 μg polyI/C intraperitoneal (diluted in PBS) on days 0, 2, and 4. Control mice received PBS. The lymphoid organs were analyzed 10 d after the last injection.
Antibodies and Flow Cytometry.
Cell suspensions (usually 106 cells per sample) were incubated with 24G2 (anti-CD16/32) hybridoma culture supernatant to reduce background. For surface stainings, the following mAbs were obtained from BD PharMingen unless otherwise indicated: 34–2-12 (anti-H-2Dd), 34–4-20S (anti-H-2Dd, obtained from American Type Culture Collection), 15–5-5 (anti-H-2Dk), KH95 (anti-H-2Db), JR9–318 (anti-Ly49A [reference 21], provided by J. Roland, Institut Pasteur, Paris, France), A1 (anti-Ly49AB6), YE1–48 (anti-Ly49A [reference 22], provided by F. Takei, University of British Columbia, Vancouver, Canada), 5E6 (anti-Ly49C/I), 4D11 (anti-Ly49G2), 4E5 (anti-Ly49D), 145–2C11 (anti-CD3ε), PK136 (anti-NK1.1), RA3–6B2 (anti-CD45R/B220), A20 (anti-CD45.1), and 104 (anti-CD45.2). These mAbs were used either biotinylated or conjugated to different fluorochromes (FITC, PE, Cy-ChromeTM [Cy], Cy 5, allophycocyanin [APC]) to allow three or four color flow cytometry. Biotinylated mAbs were revealed through staining with either streptavidin-Cy (BD PharMingen) or streptavidin-APC (Molecular Probes). The samples were analyzed on a FACSCalibur™ flow cytometer (Becton Dickinson) using CELLQuest™ software (Becton Dickinson) for data evaluation.
Mixed Bone Marrow Chimeras.
Recipient mice were injected intraperitoneally with 100 μg of purified PK136 mAb (anti-NK1.1) to deplete NK cells. They were lethally irradiated 24 h later (960 rad from a 137Cs source). 1 d after the irradiation, the recipient mice were reconstituted by intravenous injection of a 1:1 mixture of Thy-1–depleted bone marrow cells from B6 and H-2bDd mice (106 cells from each donor type). Antibiotics were added to the drinking water during the first 4 wk after reconstitution.
In Vitro Uptake of MHC Class I Molecules.
Total, erythrocyte-depleted splenocytes from two mice with different MHC haplotypes (2 × 10⁶ cells of either type) were mixed, centrifuged, and resuspended in 1 ml of culture medium.
After 2 h at 37°C, the cells were washed in culture medium and then stained for flow cytometry as described previously. For Ab-blocking studies, the cells were mixed and resuspended (without the initial centrifugation step) in 1 ml of culture medium, 1 ml of 34–4-20S (anti-Dd) hybridoma culture supernatant, or 10 μg of purified A1 (anti–Ly49AB6) in 1 ml of culture medium. Stainings were performed with mAbs specific for epitopes that are different from those used for blocking: 34–2-12 for Dd and JR9–318 for Ly49A.
NK Cell Culture.
Nylon wool nonadherent splenocytes were cultured in complete DMEM supplemented with 10% FCS, l-glutamine, Hepes buffer, β2-mercaptoethanol, and penicillin/streptomycin (all from Life Technologies) containing 500 ng/ml of recombinant human IL-2 (a gift from Glaxo IMB). The cells were incubated at 37°C at a density of 2 × 10⁶ cells per milliliter in a total volume of 10 ml/flask. At day 3, cells were either used for cytotoxicity assays or adherent cells were restimulated for 7 more days with fresh medium containing IL-2.
Chromium Release Assays.
To determine cytotoxic activities, a conventional 51Cr-release assay was performed. Briefly, 106 C1498 or Dd transfected C1498 cells (provided by W. Seaman, University of California at San Francisco, San Francisco, CA) were labeled with 50 μCi of 51Cr for 1 h at 37°C. After three washes, 5 × 10³ labeled target cells were mixed with effector cells in duplicate at various E:T ratios in 96-well U-bottomed plates. After 4 h of incubation at 37°C, supernatants were harvested and radioactivity was measured in a γ-counter. The percentages of NK cells (NK1.1+CD3−) in the effector cell cultures were determined using flow cytometry. The lysis curves were shifted relative to the content of NK cells in the B6 effector cell population.
Results
Heterogeneous Expression of Dd in Dd × MxCre Double Tg Mice.
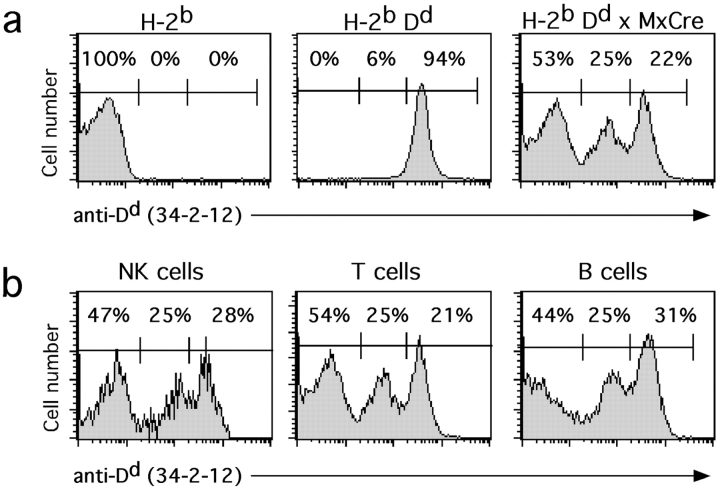
Lymphocytes in Dd single Tg mice, backcrossed to B6 mice (i.e., being H-2bDd) homogeneously expressed high levels of Dd (Fig. 1 a). In contrast, heterogeneous Dd expression with high, intermediate, and low Dd levels was observed in lymphocytes from unmanipulated Dd × MxCre double Tg mice (Fig. 1 a). Expression levels of Dd on the Dd high lymphocytes were similar to those in Dd single Tg mice. The Dd intermediate population may represent cells with a partial recombination of the multicopy Tg locus. In individual mice, the fraction of Dd low cells was comparable among NK, T, B, and NK T cells of several organs (spleen, bone marrow, peripheral blood) (Fig. 1 b and data not shown). With increasing age of the mice also the fraction of Dd low cells increased (data not shown).
Figure 1.
Heterogeneous Dd Tg expression in Dd × MxCre double Tg mice. (a) Histograms show Dd expression on splenocytes from nonTg (H-2b) (left), Dd single Tg (H-2bDd) (middle), and Dd × MxCre double Tg (right) mice. Numbers in histograms indicate the percentages of splenocytes with low, intermediate, and high Dd expression, respectively. (b) Histograms show Dd expression on splenic NK cells (NK1.1+CD3−), T cells (NK1.1−CD3+), and B cells (CD45R/B220+) of a representative Dd × MxCre double Tg mouse. Numbers in histograms indicate the percentages of splenocytes with low, intermediate, and high Dd expression, respectively. A comparable Dd distribution was found in all Dd × MxCre mice analyzed, even though the percentages of Dd low cells varied and tended to increase with age.
This “spontaneous” loss of Dd expression, which occurred in the absence of any deliberate promoter induction through injection of IFN-α or of the IFN-inducer polyI/C may be the consequence of endogenous IFN production in mice housed under conventional conditions (i.e., in a nonsterile environment). Alternatively, it may be due to leakiness of the inducible Cre Tg system.
Ly49A+ Cells Are Underrepresented among Dd Low NK Cells of Dd × MxCre Mice.
The partial loss of Dd expression had no significant effect on the abundance of NK cells in spleen and in bone marrow (data not shown). Since NK cells themselves were Dd high, intermediate, and low, we determined whether Ly49 receptors were equally abundant in the different populations. No differences were observed regarding the expression of Ly49C/I (Fig. 2), Ly49G2, or Ly49D (data not shown). Unexpectedly, Ly49A was expressed on few (6 ± 3%) Dd low NK cells, contrasting with a relatively normal percentage of expression on Dd high NK cells (22 ± 5%; Fig. 2). However, an expanded population of Ly49A+ cells was detected among NK cells with intermediate Dd levels (32 ± 7%; Fig. 2). Yet, the fraction of Ly49A+ cells among total NK cells of Dd × MxCre mice (18 ± 3%) was in the same range as that of nonTg H-2b (18 ± 3%) or Dd Tg mice (16 ± 2%). These results suggest that Ly49A+ NK cells are somehow more resistant to complete Dd loss compared with Ly49A− NK cells.
Figure 2.
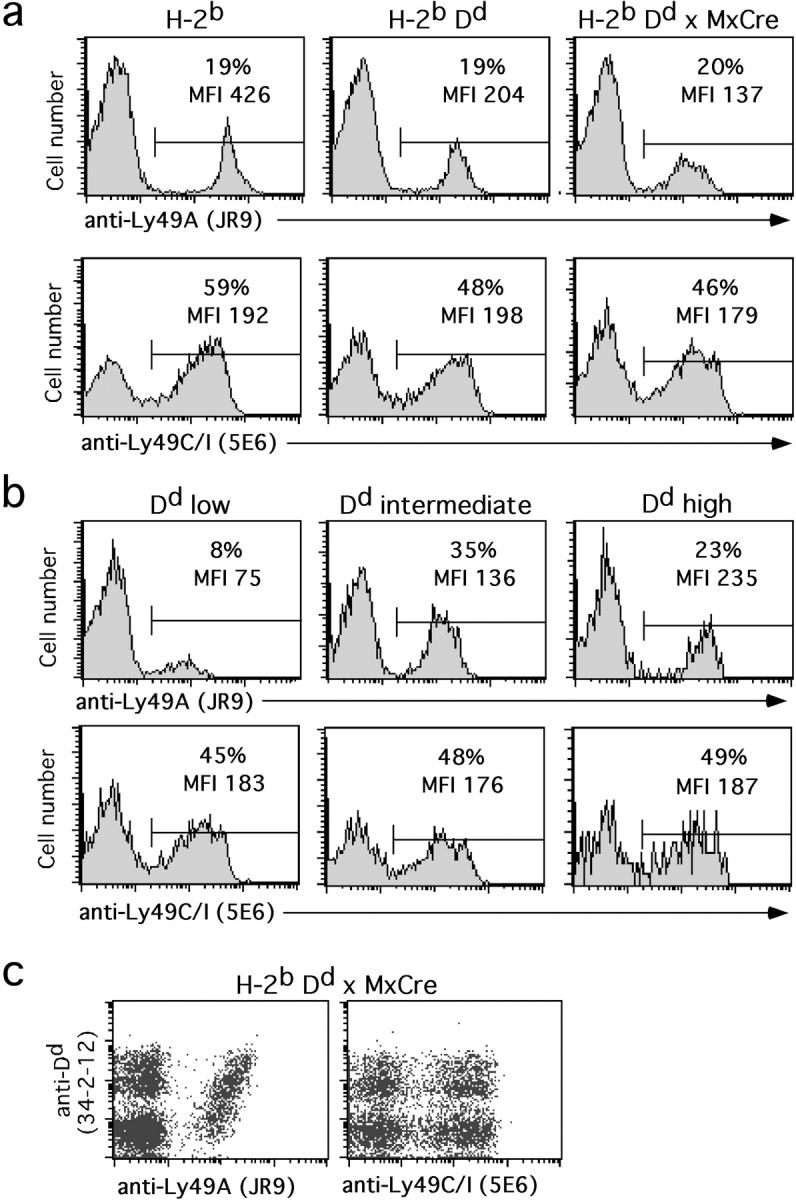
Reduced presence of Ly49A+ NK cells with low D d levels. Splenocytes from representative non Tg (H-2b), Dd single Tg (H-2bDd), and Dd × MxCre double Tg mice were stained with mAbs to Ly49A or Ly49C/I, NK1.1, CD3, and Dd and analyzed by four color flow cytometry. (a) NK cells (NK1.1+CD3−) were gated among total splenocytes and analyzed for Ly49A and Ly49C/I expression. Numbers indicate the percentages of Ly49A+ (top histograms) and Ly49C/I+ (bottom histograms) cells among NK cells from the indicated types of mice. The expression levels of Ly49A and Ly49C/I are indicated as MFI. (b) Gated NK cells (NK1.1+CD3−) from a representative Dd × MxCre double Tg mouse were subdivided according to Dd expression into Dd low, intermediate, and high cells. Numbers indicate the percentages of Ly49A+ (top histograms) and Ly49C/I+ cells (lower histograms) among the different NK cell subpopulations. The expression levels of Ly49A and Ly49C/I are indicated as MFI. (c) The density plots show expression of Ly49A (left) and Ly49C/I (right) versus Dd on splenic NK cells (NK1.1+CD3−) from a Dd × MxCre mouse.
Ly49A expression levels, measured by the mean fluorescence intensity (MFI) of Ly49A staining, were 39 ± 7% on H-2bDd as compared with H-2b NK cells, as reported previously (14). In Dd × MxCre mice, Ly49A levels were comparably reduced (30 ± 7% relative to H-2b mice). However, the three Dd-defined NK cell subsets expressed different Ly49A cell surface levels (Fig. 2). Ly49A expression levels on Dd high, intermediate, and low NK cells were 46 ± 8%, 26 ± 7%, and 17 ± 6%, respectively, relative to Ly49A levels on H-2b NK cells. Thus, in Dd mosaic mice, low Dd levels on NK cells are associated with low Ly49A levels. In contrast, the lack of Dd in B6 mice is associated with high Ly49A levels. MFIs of Ly49C/I, Ly49G2, and Ly49D were not different between the three Dd-defined types of NK cells (Fig. 2 and data not shown).
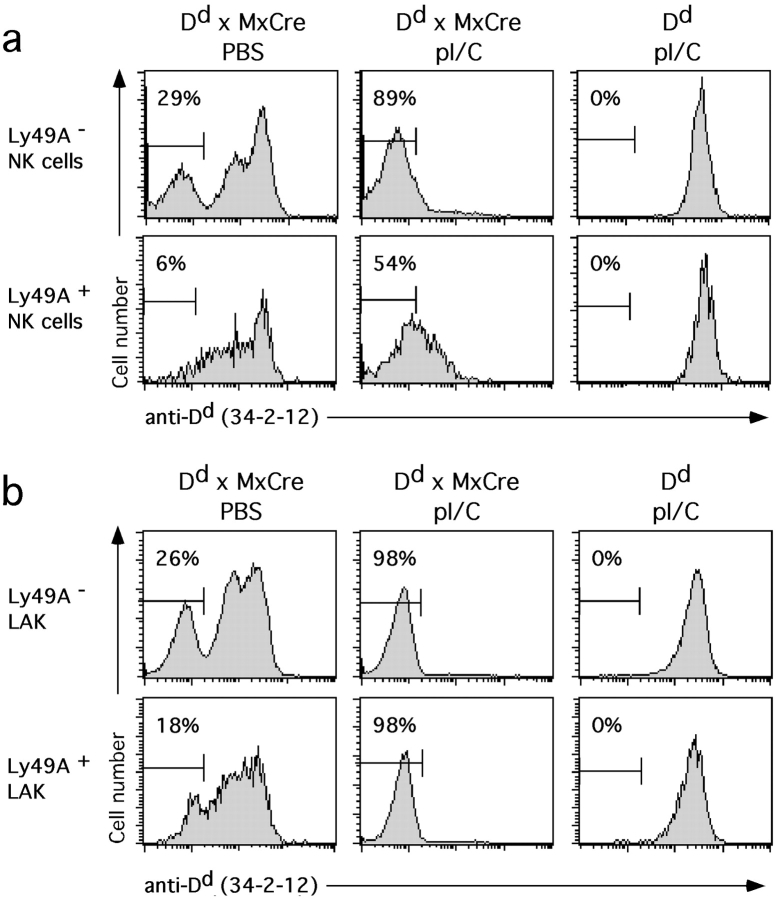
Among possible mechanisms that could account for these findings, Ly49A+ NK cells may be resistant to complete Dd recombination, perhaps due to an inactivity of the Mx promoter in these cells. To address this possibility we enforced Dd recombination in vivo by inducing Cre expression. 10 d after the last intraperitoneal injection with the IFN-inducer polyI/C, >86% of Dd × MxCre splenocytes were Dd low (data not shown). A comparable fraction (89%) of Dd low cells was observed among NK cells that do not express Ly49A (Fig. 3 a). In contrast, Ly49A+ NK cells still contained significant amounts of Dd, as only 54% of cells were in the Dd low gate (Fig. 3 a). After the culture of nylon wool nonadherent cells in IL-2 for 10 d however, essentially all (98%) Ly49A+ NK cells were Dd low (Fig. 3 b). Thus, the complete loss of Dd expression among cultured Ly49A+ NK cells indicates that these cells too had recombined their Dd Tg. However, the ex vivo analysis suggests that Dd disappears slowly from Ly49A+ NK cells when compared with Ly49A− NK cells or lymphocytes.
Figure 3.
Enforced deletion of the Dd Tg in Dd × MxCre mice. Histograms show Dd expression on NK cells from control PBS-injected Dd × MxCre (left), polyI/C injected Dd × MxCre (middle), and polyI/C injected Dd single Tg mice (right). Freshly isolated nylon-wool nonadherent splenocytes (a) or cultures established thereof (10 d in IL-2 containing medium) (b) were stained with mAbs to Ly49A, NK1.1, CD3, and Dd and analyzed by four color flow cytometry. Ly49A− (top) and Ly49A+ (bottom) NK cells (NK1.1+CD3−) were separately analyzed for Dd expression. Numbers in histograms indicate the percentages of NK cells with low Dd expression.
H-2D Ligand Uptake by Ly49A+ NK Cells In Vivo.
If recombination of the Dd Tg also occurs in Ly49A+ NK cells, Ly49A+ cells that have lost the Tg may be able to take up Dd from environmental Dd+ cells. To address this possibility we generated mixed bone marrow chimeras. Lethally irradiated H-2bDd recipients were reconstituted with a mixture of bone marrow cells derived from B6 (H-2b) and H-2bDd donors. To discriminate the two types of donor cells, we used B6 mice expressing the CD45.1 isoform of the panleucocyte marker CD45 while H-2bDd mice were CD45.2+. This allowed us to discriminate donor cells independently from Dd expression.
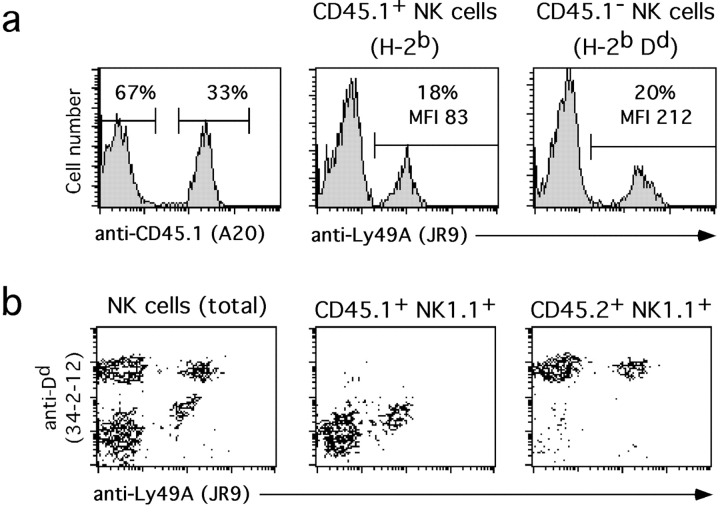
Hematopoietic chimerism in recipient mice was analyzed 2–4 mo after reconstitution through staining with anti-CD45.1 and anti-CD45.2 mAbs. ∼33% of lymphocytes in spleen (Fig. 4 a), blood and bone marrow (data not shown) were CD45.1+ and thus of B6 origin. When splenic NK cells were discriminated through CD45 expression, a normal percentage (18–20%) of Ly49A+ cells was identified among CD45.1+ (H-2b) and CD45.1− (H-2bDd) cells (Fig. 4 a). However, CD45.1+ NK cells (of B6 origin) appeared as Dd intermediate cells (Fig. 4 b). As these cells are genetically Dd-deficient, our findings imply that they have acquired Dd molecules from environmental Dd+ cells in vivo. Similarly, Ly49A+ NK cells that have recombined their Dd Tg in the Dd × MxCre situation may thus take up Dd from environmental Dd+ cells and appear as Dd intermediate cells.
Figure 4.
Uptake of Dd molecules by Ly49A+ NK cells in vivo. Lethally irradiated H-2bDd (CD45.2+) recipients were reconstituted with a 1:1 mixture of bone marrow cells from B6 (CD45.1+) and H-2bDd (CD45.2+) mice and spleens analyzed 2–4 mo after reconstitution. The data shown are representative of three different experiments with similar results. (a) Nylon wool nonadherent splenocytes from a mixed bone marrow chimera were stained with mAbs to Ly49A, NK1.1, CD3, and CD45.1 and analyzed by four color flow cytometry. Ly49A expression was analyzed among CD45.1+ (B6) and CD45.1− (H-2bDd) NK cells. Numbers correspond to the percentages of Ly49A+ NK cells and the expression levels of Ly49A (MFI). (b) Density plots show expression of Ly49A versus Dd on splenic NK cells (NK1.1+CD3−) (left), Ly49A versus Dd on gated CD45.1+ (H-2b-derived) NK1.1+ splenocytes (middle), and Ly49A versus Dd on gated CD45.2+ (H-2bDd-derived) NK1.1+ splenocytes (right) from a representative mixed chimera.
On the Dd-expressing NK cells, Ly49A expression levels in the mixed chimeras were ∼50% of control B6 mice. In contrast, on CD45.1+ (H-2b) NK cells Ly49A levels were approximately threefold further reduced (16% of B6 controls). Thus, similar to mosaic mice, in a Dd+ environment in mixed H-2b/H-2bDd bone marrow chimeras the lack of endogenous Dd on Ly49A+ NK cells is associated with very low Ly49A levels.
H-2D Ligand Uptake via the Ly49A Receptor In Vitro.
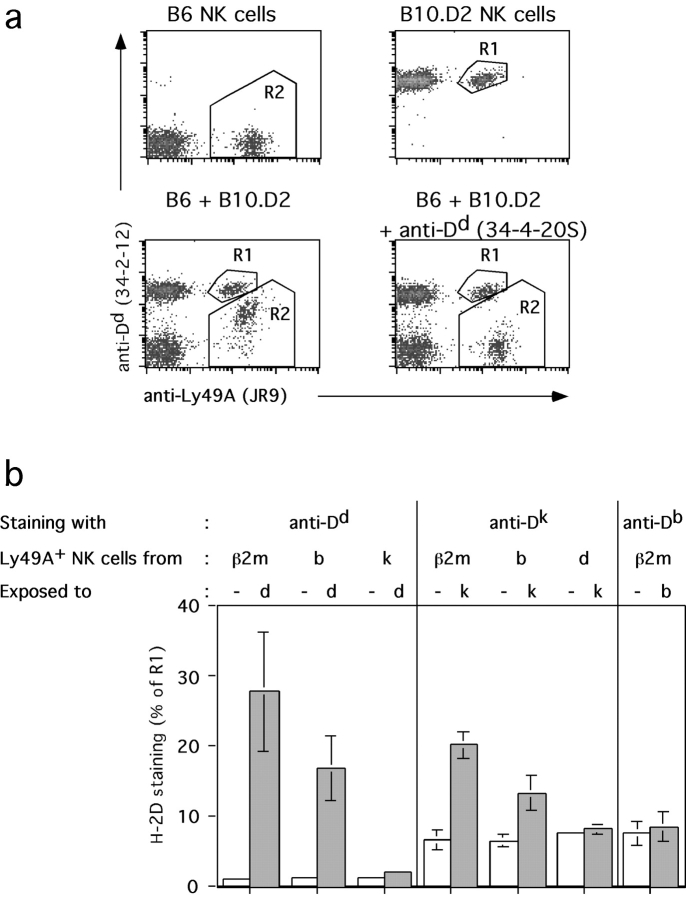
To obtain further evidence that Dd molecules can be acquired by Ly49A+ NK cells, we mixed splenocytes from B6 (H-2b) mice with splenocytes from Dd Tg or from B10.D2 (H-2d) mice. The cells were mixed and incubated at 37°C for 2 h before staining and FACS® analysis. Indeed, Ly49A+ NK cells from B6 mice became significantly Dd+ (Fig. 5 a). The transfer of Dd molecules was completely blocked by the addition of either the anti-Dd mAb 34–4-20S (Fig. 5 a) or the anti-Ly49A mAb A1 (data not shown) demonstrating that H-2Dd uptake is dependent on the Ly49A receptor. In agreement with the in vivo data, the majority of Ly49C/I+, Ly49G2+, and Ly49D+ NK cells from B6 mice remained Dd low (data not shown).
Figure 5.
Specificity of uptake of H-2D alleles in vitro. (a) Total splenocytes from B6 (H-2b) and B10.D2 (H-2d) mice were mixed and incubated for 2 h at 37°C. The expression of Ly49A versus Dd among gated NK cells (NK1.1+CD3−) is shown for B6 (top left) and B10.D2 cells (top right). Mixed populations of B6 plus B10.D2 cells were left untreated (bottom left) or incubated with an anti-Dd mAb (34–4-20S) (bottom right). (b) Total splenocytes from MHC class I–deficient (β2m−/−), B6 (H-2b), Dd single Tg (H-2bDd), B10.D2 (H-2d), or B10.BR (H-2k) mice were mixed in various combinations and stained with mAbs to Dd, Dk, or Db together with mAbs to Ly49A, CD3, and NK1.1. Expression of Ly49A versus Dd, Dk, or Db was analyzed among Ly49A+ NK cells (NK1.1+CD3−). The MFI of H-2D alleles on Ly49A+ NK cells expressing the respective gene was arbitrarily assigned the value 100 (R1 in a). The extent of uptake of the H-2D alleles by Ly49A+ NK cells was determined by the MFI in R2 and indicated as a percentage of R1. The MFI of the H-2D allele on Ly49A+ NK cells that do not express the respective gene and that were not mixed with other cells represents the background staining. Data show means (± SD) of usually three or more independent experiments.
H-2D Ligand Uptake Reflects the Affinity of Ly49A to Different H-2D Alleles.
To determine the specificity of acquisition of class I molecules by Ly49A, we analyzed two additional MHC class I molecules, Dk and Db. The former represents a strong ligand of Ly49A, although with somewhat lower affinity than Dd. A very weak interaction of Ly49A with Db is mainly suggested by developmental and functional evidence (8–10, 23, 24). The “donors” of Dd, Dk, and Db molecules (splenocytes from Dd single Tg or B10.D2 [H-2d], B10.BR [H-2k], and B6 [H-2b] mice, respectively) were mixed with MHC class I–deficient (β2m−/−) splenocytes, centrifuged, incubated, and stained as above. Class I uptake was determined based on increases of Dd, Dk, and Db MFI on β2m−/− Ly49A+ NK cells. Ly49A+ NK cells from β2m−/− mice efficiently acquired Dd (28 ± 9% as compared with Dd levels on H-2d Ly49A+ NK cells) and less efficiently Dk (17 ± 5% of Dk levels on H-2k Ly49A+ NK cells). In contrast, Db acquisition was insignificant (Fig. 5 b). The extent of uptake thus reflects the affinity of Ly49A for certain H-2D alleles. A requirement for high affinity interactions may explain why Dd uptake via Ly49C/I, Ly49G2, and Ly49D receptors was not detected.
H-2D Ligand Expression by Ly49A+ NK Cells Prevents Ligand Uptake.
We further investigated whether Ly49A+ NK cells expressing themselves a ligand for Ly49A (Dd or Dk), are able to acquire a ligand from environmental cells. For this purpose, we mixed splenocytes from H-2d mice with those from H-2k mice. Interestingly, the acquisition of Dd by H-2k Ly49A+ NK cells as well as the acquisition of Dk by H-2d Ly49A+ NK cells was very low to undetectable (Fig. 5 b). In contrast, Ly49A+ NK cells from H-2b mice efficiently took up Dd as well as Dk (Fig. 5 b).
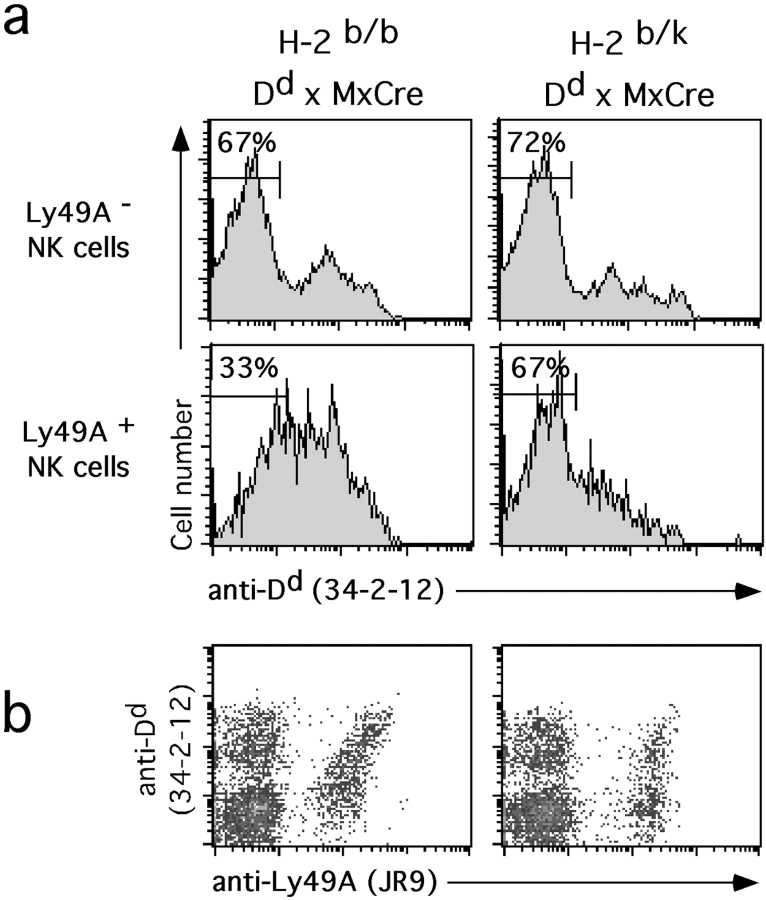
To confirm the relative absence of H-2D ligand uptake from environmental cells in the presence of a ligand on Ly49A+ NK cells, we crossed Dd × MxCre mice to B10.BR (H-2k) mice. In control Dd × MxCre mice (H-2b/b background), we observed significantly fewer Dd low Ly49A+ as compared with Ly49A− NK cells (Fig. 6), consistent with Dd uptake via Ly49A. In contrast, in Dd × MxCre mice of H-2k/b background, the fraction of Dd low cells was similar among Ly49A+ and Ly49A− NK cells (Fig. 6). These findings suggest that Dd uptake by Ly49A did not occur. They corroborate the in vitro results and suggest that H-2 ligand uptake from environmental cells does not detectably occur when a H-2 ligand is expressed on Ly49A+ NK cells.
Figure 6.
H-2k expression prevents Dd uptake in vivo. Splenocytes from H-2b/b Dd × MxCre and H-2b/k Dd × MxCre double Tg mice were stained with mAbs to Ly49A, NK1.1, CD3, and Dd and analyzed by four color flow cytometry. (a) Histograms show Dd expression on Ly49A− (top) and Ly49A+ (bottom) NK cells (NK1.1+CD3−) of the two types of mice. Numbers in histograms indicate the percentages of NK cells with low Dd expression. (b) Density plots show expression of Ly49A versus Dd on gated NK cells (NK1.1+CD3−) from the two types of mice.
Reduced Binding of mAb A1 to Ly49A on Dd+ NK Cells.
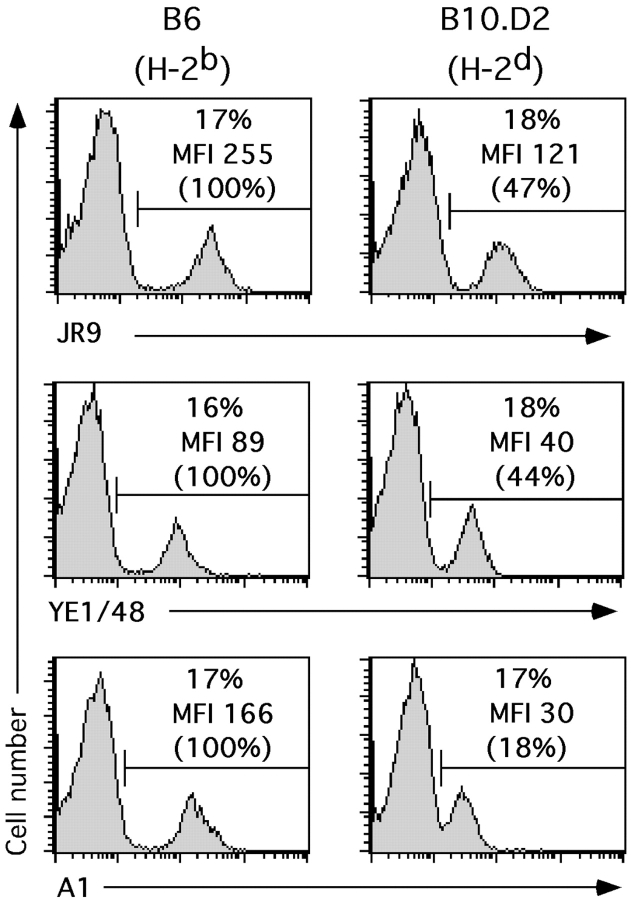
The above findings raise the possibility that H-2 ligand expression by NK cells influences the structure of Ly49A and/or its accessibility. To test this possibility we stained NK cells from different haplotypes with the available anti-Ly49A mAbs A1, JR9–318, and YE1–48. NK cells from β2m−/− mice stained brightly with all mAbs. Staining intensities with each of the three mAbs were ∼20–30% lower on H-2b NK cells (data not shown). On H-2d and H-2bDd NK cells, the intensity of Ly49A staining with JR9–318 and YE1–48 mAbs was between 40–50% of B6 controls, in agreement with numerous previous studies reviewed in reference 25. Even though considerable amounts of Ly49A were still detected using the above mAbs, A1 staining of H-2d and H-2bDd NK cells was reduced to 14 ± 4% of B6 controls (Fig. 7 and data not shown). The binding of mAb A1 to its epitope on Ly49A is thus strongly and selectively impaired as a consequence of Dd expression.
Figure 7.
Reduced binding of mAb A1 to Ly49A on Dd+ NK cells. Splenocytes from B6 (H-2b) and B10.D2 (H-2d) mice were stained with mAbs to NK1.1 and CD3 together with the indicated anti-Ly49A mAbs (JR9, YE1–48, or A1), and analyzed by flow cytometry. Histograms show anti-Ly49A stainings using the indicated mAb among gated NK cells (NK1.1+CD3−). Numbers indicate percentages of gated Ly49A+ NK cells and the MFI of Ly49A expression. Numbers in brackets express the MFI as a percentage of the one obtained for Ly49A+ NK cells from B6 mice (=100).
Reduced Inhibitory Capacity of Ly49A on NK Cells from Dd+ Mice.
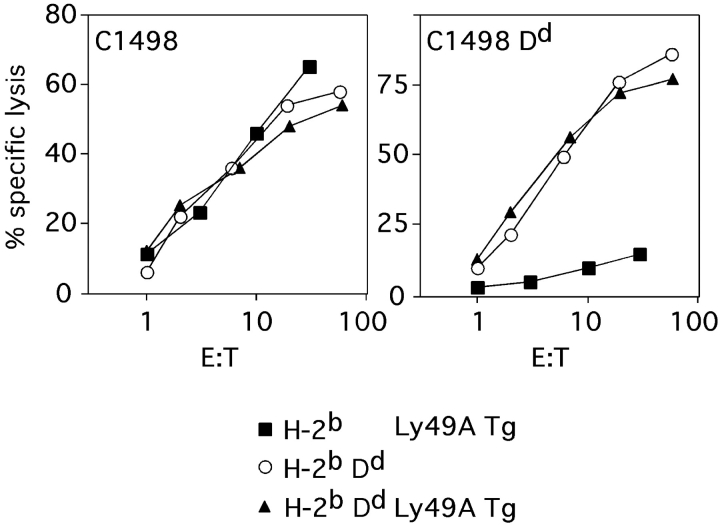
We have further tested whether the Dd-dependent reduction of ligand uptake by and binding of A1 to Ly49A correlated with an altered inhibitory function of Ly49A+ NK cells from Dd+ mice. To circumvent mAb-dependent purification steps we have used effector cell populations from Ly49A Tg mice that express Ly49A on all NK cells (20). Ly49A expressed by Dd+ NK cells inhibited the lysis of Dd+ lymphoblast targets (13), consistent with other reports (14–16, 26, 27). In contrast, H-2bDd tumor targets (C1498 Dd) were efficiently lysed by NK cells from Dd × Ly49A Tg (H-2bDd) mice. These targets were essentially not killed by NK cells from H-2b Ly49A Tg mice, even though all NK cell populations efficiently killed the parental C1498 target cells (Fig. 8). Our data confirm and extent earlier reports (14, 27), indicating that the inhibitory capacity of Ly49A on H-2bDd NK cells is at least 10-fold reduced as compared with H-2b NK cells. In H-2bDd NK cells, Ly49A-mediated inhibition may be sufficient to prevent the lysis of lymphoblast targets but not that of C1498 Dd cells which most likely provide more activation signals to NK cells. These findings correlate well with reduced H-2 ligand uptake, limited Ly49A downmodulation, and reduced A1 binding and suggest that structural constraints limit Ly49A binding to H-2 ligand when a H-2 ligand is expressed on NK cells themselves.
Figure 8.
Inefficient inhibition of Dd+ NK cells by Ly49A. Short-term (3 d) IL-2–activated NK cells were generated from Ly49A single Tg (H-2b) (black squares), Dd single Tg (H-2bDd) (white circles), and Dd × Ly49A double Tg (H-2bDd) (black triangles) mice. Cytotoxic activity of these preparations to the tumor cell line C1498 (H-2b) and Dd-transfected C1498 (C1498 Dd) was tested in a standard 4-h Cr release assay.
Discussion
We have generated a novel mouse model in which cells with high, intermediate, and low levels of a MHC class I molecule coexist in individual mice. Surprisingly, NK cells expressing Ly49A were virtually all Dd high or intermediate but not Dd low. Mixed bone marrow chimeras established that H-2b Ly49A+ NK cells can acquire Dd molecules from environmental Dd+ cells in vivo. The specific acquisition of Dd molecules via the Ly49A receptor was further demonstrated by in vitro coculture experiments. Indeed, the Ly49A receptor mediated only the uptake of its strong ligands Dd or Dk but not of the weak ligand Db.
The uptake of class I molecules by Ly49A+ NK cells resembles the acquisition of target cell molecules by other lymphocyte populations. CD8+ T lymphocytes rapidly acquire specific peptide–MHC class I complexes from APC (28–30). This acquisition is mediated through the TCR and strictly depends on the presence of the appropriate peptide/MHC class I complex. Furthermore, CD8+ and CD4+ T cells acquire, specifically through the CD28 costimulatory molecule, CD80 from APC (29, 31). Similarly, B cells can take up specific membrane-bound antigens via their BCR (32). Although mediated through specific TCR–MHC, CD28–CD80, or BCR–antigen interactions, the acquisition is often not limited to these particular ligands but extends to various other cell surface molecules, as entire membrane fragments may be transferred from APC to T cells (30). In most of these situations, the resulting complexes are rapidly internalized and degraded (28, 29, 32). It seems thus likely that also in NK cells Ly49A–Dd complexes are subject to internalization and degradation.
Unexpectedly, when NK cells expressed Dd, the Ly49A-mediated acquisition of Dk, an alternative Ly49A ligand, from environmental cells was very inefficient. H-2 ligand expression by Ly49A+ NK cells thus interferes with ligand uptake mediated by Ly49A. It is useful to consider these findings in the context of the recent resolution of the crystallographic structure of the Ly49A/H-2Dd complex (19). This structure revealed the interaction of Ly49A with two distinct sites of Dd. Ly49A interacted with amino terminal residues of the α1 helix and COOH-terminal residues of the α2 helix of Dd (site 1). The other site is located beneath the floor of the peptide binding groove, making contact with residues of the α2, α3, and β2m domains (site 2). The relative importance of these two sites (as well as additional residues identified by site directed mutagenesis) for the interaction of Ly49A with Dd on target cells (interaction in trans) has not been resolved (33–37). It is possible that interactions at both sites are required for functional NK cell–target cell interactions. As a surprise, however, in addition to an interaction in trans, site 2 may allow an interaction of Dd with Ly49A on the same cell (cis interaction; reference 19). Therefore, we propose that the uptake of Dd from environmental cells is severely impaired due to an interaction of Ly49A in cis with its Dd ligand.
A number of findings reported here and by others are in agreement with cis effects of Dd on Ly49A. Ly49A levels on NK cells are downmodulated approximately twofold in the presence as compared with the absence of Dd based on antibody stainings (14, 38). Surprisingly, in a Dd+ environment, Ly49A+ NK cells which themselves do not express Dd are more susceptible to Ly49A downmodulation than those expressing Dd (Figs. 2 and 4; reference 39). Indeed, Dk expression in cis limited Ly49A downmodulation upon the interaction with Dd in trans (Fig. 6 b).
Historically, Ly49A+ NK cells were initially not detectable in H-2d mice using mAb A1. Indeed, we find that the staining with mAb A1 is at least fivefold less intense than on H-2b NK cells. That is in contrast to two other mAbs, which yielded twofold reductions. Binding of mAb A1 to its epitope is thus specifically affected by Dd expression on NK cells. The binding of mAb A1 to the carbohydrate recognition domain of Ly49A together with its binding to Ly49AB6, Ly49ANOD, and Ly49PNOD but not to Ly49ABalb suggests that the A1 epitope depends on a threonine residue on position 138 of Ly49A (40–42). Interestingly, this residue makes contact with site 2 of the Dd molecule (19). A1 binding to Ly49A may thus be inefficient because Dd is associated with Ly49A, thereby masking the A1 epitope.
Along those same lines it was reported that Dd tetramers readily bind to Ly49A on H-2b NK cells. However, they do apparently not bind well to Ly49A expressed on H-2d NK cells (10, 43). This was explained in principal by the (twofold) reduced levels of Ly49A on NK cells from H-2d compared with those from H-2b mice (based on mAb stainings) having a critical threshold effect obliterating tetramer staining. However, soluble Ly49A reagents readily interacted with Dd expressed on various lymphocyte populations (44–46). This apparent discrepancy is readily resolved if H-2 ligand expression by Ly49A receptor bearing NK cells renders Ly49A interactions with Dd ligands encountered in trans inefficient. Therefore, collectively there is ample evidence that Dd expression by Ly49A+ NK cells alters the accessibility of the Ly49A receptor. These findings are all compatible with an association in cis of Dd with Ly49A. We are currently attempting to obtain direct evidence for such an association.
Is ligand loss from or ligand uptake by Ly49A+ NK cells of functional relevance? First, we have considered the possibility that the loss of the Dd gene by Ly49A+ NK cells, which may terminate a cis interaction, is relevant for the survival of these NK cells. Indeed, it has been shown that the Cre/loxP–mediated loss of surface Igs (BCR) on mature B cells leads to their rapid apoptotic death, suggesting that the BCR provides survival signals to B cells (47). A similar survival signal provided to NK cells through Ly49A–Dd interactions in our model seems unlikely, since the fraction of Ly49A+ cells among total NK cells was not reduced in Dd × MxCre mice. In addition, even the enforced deletion of Dd using polyI/C treatment of Dd × MxCre mice, did not negatively affect the number of Ly49A+ NK cells. Although it could be argued that in Dd × MxCre mice Ly49A+ NK cells are never completely devoid of Dd.
A role of H-2 ligand uptake in vivo is not immediately obvious, especially since it seems to efficiently occur only in exceptional cases such as a class I mosaic situation. It is also worth to point out that in contrast to T cells, the functional consequence of an interaction that results in ligand uptake, is NK cell inhibition and not cellular activation. One could thus envisage two roles for ligand uptake: first it may facilitate the detachment from target cells and/or ligand uptake could participate in inhibitory signaling perhaps once the complex has been internalized (48). Indeed, Ly49A-mediated ligand uptake correlates with efficient NK cell inhibition in H-2b NK cells.
While the above issues remain to be addressed, the relative absence of ligand uptake by Ly49A has prompted us to reevaluate the accessibility and function of Ly49A on Dd+ NK cells. Indeed, the inhibitory capacity of the Ly49A receptor on H-2bDd NK cells was considerably reduced as compared with H-2b NK cells. Dd+ tumor target cells that inhibited lysis by Ly49A+ NK cells from H-2b mice were readily killed by Ly49A+ NK cells from H-2bDd mice (Fig. 8; references 14 and 27). The latter NK cells are thus more sensitive to increases in activation signals and/or subtle reductions in Dd levels. Previously, this effect has been attributed to the approximately twofold lower levels of Ly49A on H-2d as compared with H-2b NK cells. However, our results suggest that the inhibitory capacity of Ly49A on H-2d NK cells is at least 10-fold reduced as compared with H-2b NK cells (Fig. 8). Based on these findings it is conceivable that it is the limited accessibility of Ly49A due to Dd expression in cis, which renders Dd+ Ly49A+ NK cells particularly sensitive to detect subtle alterations in Dd expressing environmental cells. Hence, Dd expression in cis may be important to establish the fine specificity of Ly49A+ NK cells.
Collectively, we provide evidence that H-2 ligand expression by NK cells significantly affects the behavior of the inhibitory Ly49A NK cell receptor. Ligand expression by NK cells drastically reduces the accessibility of Ly49A to ligands encountered in trans, on environmental cells. Reduced accessibility may be responsible for the increased sensitivity of the Ly49A receptor in Dd+ NK cells. Small reductions of Dd levels and/or increases of ligands for activating receptors on target cells are sufficient to abrogate Ly49A-mediated NK cell inhibition, allowing target cell lysis to proceed.
Acknowledgments
We thank F. Beermann for Tg injections, M. Aguet for providing Mx1-Cre Tg mice, J. Roland, and F. Takei for providing mAbs, W. Seaman for providing C1498 cells and J.-C. Cerottini for critical reading of the manuscript.
W. Held is the recipient of a START fellowship and supported in part by a grant from the Swiss National Science Foundation.
Footnotes
Abbreviations used in this paper: APC, allophycocyanin; MFI, mean fluorescence intensity; polyI/C, polyinosinic-polycytidylic acid; Tg, transgenic/transgene.
References
- 1.Biron, C.A., K.B. Nguyen, G.C. Pien, L.P. Cousens, and T.P. Salazar-Mather. 1999. Natural killer cells in antiviral defense: function and regulation by innate cytokines. Annu. Rev. Immunol. 17:189–220. [DOI] [PubMed] [Google Scholar]
- 2.Ljunggren, H.G., and K. Kärre. 1990. In search of the ‘missing self’: MHC molecules and NK cell recognition. Immunol. Today. 11:237–244. [DOI] [PubMed] [Google Scholar]
- 3.Lanier, L.L., B. Corliss, and J.H. Phillips. 1997. Arousal and inhibition of human NK cells. Immunol. Rev. 155:145–154. [DOI] [PubMed] [Google Scholar]
- 4.Cerwenka, A., A.B.H. Bakker, T. McClanahan, J. Wagner, J. Wu, J.H. Phillips, and L.L. Lanier. 2000. Retinoic acid early inducible genes define a ligand family for the activating NKG2D receptor in mice. Immunity. 12:721–727. [DOI] [PubMed] [Google Scholar]
- 5.Diefenbach, A., A.N. Jamieson, S. Liu, N. Shastri, and D.H. Raulet. 2000. Ligands for the murine NKG2D receptor: expression by tumor cells and activation of NK cells and macrophages. Nat. Immunol. 1:95–97. [DOI] [PubMed] [Google Scholar]
- 6.Lanier, L.L. 1998. NK cell receptors. Annu. Rev. Immunol. 16:359–393. [DOI] [PubMed] [Google Scholar]
- 7.Long, E.O. 1999. Regulation of immune responses through inhibitory receptors. Annu. Rev. Immunol. 17:875–904. [DOI] [PubMed] [Google Scholar]
- 8.Karlhofer, F.M., R.K. Ribaudo, and W.M. Yokoyama. 1992. MHC class I alloantigen specificity of Ly-49+ IL-2 activated natural killer cells. Nature. 358:66–70. [DOI] [PubMed] [Google Scholar]
- 9.Kane, K. 1994. Ly-49 mediates EL4 lymphoma adhesion to isolated class I major histocompatibility complex molecules. J. Exp. Med. 179:1011–1015. [DOI] [PMC free article] [PubMed] [Google Scholar]
- 10.Hanke, T., H. Takizawa, C.W. McMahon, D.H. Busch, E.G. Pamer, J.D. Miller, J.D. Altman, Y. Liu, D. Cado, F.A. Lemonnier, et al. 1999. Direct assessment of MHC class I binding by seven Ly49 inhibitory NK cell receptors. Immunity. 11:67–77. [DOI] [PubMed] [Google Scholar]
- 11.Raulet, D.H., R.E. Vance, and C.W. McMahon. 2001. Regulation of the natural killer cell receptor repertoire. Annu. Rev. Immunol. 19:291–330. [DOI] [PubMed] [Google Scholar]
- 12.Ohlen, C., G. Kling, P. Höglund, M. Hansson, G. Scangos, C. Bieberich, G. Jay, and K. Karre. 1989. Prevention of allogeneic bone marrow graft rejection by H-2 transgene in donor mice. Science. 246:666–668. [DOI] [PubMed] [Google Scholar]
- 13.Ioannidis, V., J. Zimmer, F. Beermann, and W. Held. 2001. Cre recombinase-mediated inactivation of H-2Dd transgene expression: evidence for partial missing-self recognition by Ly49A NK cells. J. Immunol. In press. [DOI] [PubMed] [Google Scholar]
- 14.Olsson, M.Y., K. Karre, and C.L. Sentman. 1995. Altered phenotype and function of natural killer cells expressing the major histocompatibility complex receptor Ly-49 in mice transgenic for its ligand. Proc. Natl. Acad. Sci. USA. 92:1649–1653. [DOI] [PMC free article] [PubMed] [Google Scholar]
- 15.Dorfman, J.R., and D.H. Raulet. 1996. Major histocompatibility complex genes determine natural killer cell tolerance. Eur. J. Immunol. 26:151–155. [DOI] [PubMed] [Google Scholar]
- 16.Yu, Y.Y., T. George, J. Dorfman, J. Roland, V. Kumar, and M. Bennett. 1996. The role of Ly49A and 5E6 (Ly49C) molecules in hybrid resistance mediated by murine natural killer cells against normal T cell blasts. Immunity. 4:67–76. [DOI] [PubMed] [Google Scholar]
- 17.Kuhn, R., F. Schwenk, M. Aguet, and K. Rajewsky. 1995. Inducible gene targeting in mice. Science. 269:1427–1429. [DOI] [PubMed] [Google Scholar]
- 18.Johansson, M.H., C. Bieberich, G. Jay, K. Kärre, and P. Höglund. 1997. Natural killer cell tolerance in mice with mosaic expression of major histocompatibility complex class I molecules. J. Exp. Med. 186:353–364. [DOI] [PMC free article] [PubMed] [Google Scholar]
- 19.Tormo, J., K. Natarajan, D.H. Margulies, and R.A. Mariuzza. 1999. Crystal structure of a lectin-like natural killer cell receptor bound to its MHC class I ligand. Nature. 402:623–631. [DOI] [PubMed] [Google Scholar]
- 20.Held, W., D. Cado, and D.H. Raulet. 1996. Transgenic expression of the Ly49A natural killer cell receptor confers class I major histocompatibility complex (MHC)-specific inhibition and prevents bone marrow allograft rejction. J. Exp. Med. 184:2037–2041. [DOI] [PMC free article] [PubMed] [Google Scholar]
- 21.Roland, J., and P.A. Cazenave. 1992. Ly-49 antigen defines an αβ TCR population in i-IEL with an extrathymic maturation. Int. Immunol. 4:699–706. [DOI] [PubMed] [Google Scholar]
- 22.Chan, P.Y., and F. Takei. 1986. Expression of a T cell receptor-like molecule on normal and malignant murine T cells detected by rat monoclonal antibodies to nonclonotypic determinants. J. Immunol. 136:1346–1353. [PubMed] [Google Scholar]
- 23.Held, W., and D.H. Raulet. 1997. Ly49A transgenic mice provide evidence for a major histocompatibility complex-dependent education process in natural killer cell development. J. Exp. Med. 185:2079–2088. [DOI] [PMC free article] [PubMed] [Google Scholar]
- 24.Brawand, P., F.A. Lemonnier, H.R. MacDonald, J.C. Cerottini, and W. Held. 2000. Transgenic expression of Ly49A on T cells impairs a specific anti-tumor response. J. Immunol. 165:1871–1876. [DOI] [PubMed] [Google Scholar]
- 25.Hoglund, P., J. Sundback, M.Y. Olsson-Alheim, M. Johansson, M. Salcedo, C. Ohlen, H.G. Ljunggren, C.L. Sentman, and K. Karre. 1997. Host MHC class I gene control of NK-cell specificity in the mouse. Immunol. Rev. 155:11–28. [DOI] [PubMed] [Google Scholar]
- 26.Deleted in proof.
- 27.Olsson-Alheim, M.Y., M. Salcedo, H.-G. Ljunggren, K. Kärre, and C.L. Sentman. 1997. NK cell receptor calibration. Effects of MHC class I induction on killing by Ly49Ahigh and Ly49Alow NK cells. J. Immunol. 159:3189–3194. [PubMed] [Google Scholar]
- 28.Huang, J.F., Y. Yang, H. Sepulveda, W. Shi, I. Hwang, P.A. Peterson, M.R. Jackson, J. Sprent, and Z. Cai. 1999. TCR-mediated internalization of peptide-MHC complexes by T cells. Science. 286:952–954. [DOI] [PubMed] [Google Scholar]
- 29.Hwang, I., J.F. Huamg, H. Kishimoto, A. Brunmark, P.A. Peterson, M.R. Jackson, C.D. Surh, Z. Cai, and J. Sprent. 2000. T cells can use either T cell receptor or CD28 receptors to absorb and internalize cell surface molecules derived from antigen-presenting cells. J. Exp. Med. 191:1137–1148. [DOI] [PMC free article] [PubMed] [Google Scholar]
- 30.Hudrisier, D., J. Riond, H. Mazarguil, J.E. Gairin, and E. Joly. 2001. CTLs rapidly capture membrane fragments from target cells in a TCR signaling-dependent manner. J. Immunol. 166:3645–3649. [DOI] [PubMed] [Google Scholar]
- 31.Sabzevari, H., J. Kantor, A. Jaigirdar, Y. Tagya, M. Naramura, J.W. Hodge, J. Bernon, and J. Schlom. 2001. Acquisition of CD80 (B7-1) by T cells. J. Immunol. 166:2505–2513. [DOI] [PubMed] [Google Scholar]
- 32.Batista, F.D., D. Iber, and M.S. Neuberger. 2001. B cells acquire antigen from target cells after synapse formation. Nature. 411:489–494. [DOI] [PubMed] [Google Scholar]
- 33.Sundbäck, J., M.C. Nakamura, M. Waldenstrom, E.C. Niemi, W.E. Seaman, J.C. Ryan, and K. Karre. 1998. The α2 domain of H-2Dd restricts the allelic specificity of the murine NK cell inhibitory receptor Ly-49A. J. Immunol. 160:5971–5978. [PubMed] [Google Scholar]
- 34.Matsumoto, N., R.K. Ribaudo, J.P. Abastado, D.H. Margulies, and W.M. Yokoyama. 1998. The lectin-like NK cell receptor Ly-49A recognizes a carbohydrate-independent epitope on its MHC class I ligand. Immunity. 8:245–254. [DOI] [PubMed] [Google Scholar]
- 35.Waldenström, M., J. Sundbäck, M.Y. Olsson-Alheim, A. Achour, and K. Kärre. 1998. Impaired MHC class I (H-2Dd)-mediated protection against Ly-49A+ NK cells after amino acid substitutions in the antigen binding cleft. Eur. J. Immunol. 28:2872–2881. [DOI] [PubMed] [Google Scholar]
- 36.Nakamura, M.C., S. Hayashi, E.C. Niemi, J.C. Ryan, and W.E. Seaman. 2000. Activating Ly-49D and inhibitory Ly-49A natural killer cell receptors demonstrate distinct requirements for interaction with H2-Dd. J. Exp. Med. 192:447–453. [DOI] [PMC free article] [PubMed] [Google Scholar]
- 37.Matsumoto, N., M. Mitsuki, K. Tajima, W.M. Yokoyama, and K. Yamamoto. 2001. The functional binding site for the C-type lectin-like natural killer cell receptor Ly49A spans three domains of its major histocompatibility complex class I ligand. J. Exp. Med. 193:147–157. [DOI] [PMC free article] [PubMed] [Google Scholar]
- 38.Karlhofer, F.M., R. Hunziker, A. Reichlin, D.H. Margulies, and W.M. Yokoyama. 1994. Host MHC class I molecules modulate in vivo expression of a NK cell receptor. J. Immunol. 153:2407–2416. [PubMed] [Google Scholar]
- 39.Kase, A., M.H. Johansson, M.Y. Olsson-Alheim, K. Kärre, and P. Höglund. 1998. External and internal calibration of the MHC class I-specific receptor Ly49A on murine natural killer cells. J. Immunol. 161:6133–6138. [PubMed] [Google Scholar]
- 40.Held, W., J. Roland, and D.H. Raulet. 1995. Allelic exclusion of Ly49 family genes encoding class I-MHC-specific receptors on NK cells. Nature. 376:355–358. [DOI] [PubMed] [Google Scholar]
- 41.Brennan, J., G. Mahon, D.L. Mager, W.A. Jefferies, and F. Takei. 1996. Recognition of class I major histocompatibility complex molecules by Ly49: specificities and domain interactions. J. Exp. Med. 183:1553–1559. [DOI] [PMC free article] [PubMed] [Google Scholar]
- 42.Silver, E.T., D.-E. Gong, C.S. Chang, A. Amrani, P. Santamaria, and K.P. Kane. 2000. Ly-49P activates NK-mediated lysis by recognizing H-2Dd. J. Immunol. 165:1771–1781. [DOI] [PubMed] [Google Scholar]
- 43.Michaelsson, J., A. Achour, M. Salcedo, A. Kase-Sjöström, J. Sudback, R.A. Harris, and K. Kärre. 2000. Visualization of inhibitory Ly49 receptor specificity with soluble major histocompatibility complex class I tetramers. Eur. J. Immunol. 30:300–307. [DOI] [PubMed] [Google Scholar]
- 44.Natarajan, K., L.F. Boyd, P. Schuck, W.M. Yokoyama, D. Eilat, and D.H. Margulies. 1999. Interaction of the NK cell inhibitory receptor Ly49A with H-2Dd: identification of a site distinct from the TCR site. Immunity. 11:591–601. [DOI] [PubMed] [Google Scholar]
- 45.Chung, D.H., K. Natarajan, L.F. Boyd, J. Tormo, R.A. Mariuzza, W.M. Yokoyama, and D.H. Margulies. 2000. Mapping the ligand of the NK inhibitory receptor Ly49A on living cells. J. Immunol. 165:6922–6932. [DOI] [PubMed] [Google Scholar]
- 46.Matsumoto, N., K. Tajima, M. Mitsuki, and K. Yamamoto. 2001. H-2 allele specificity of the NK cell C-type lectin-like MHC class I receptor Ly49A visualized by soluble Ly49A tetrAm. Int. Immunol. 13:615–623. [DOI] [PubMed] [Google Scholar]
- 47.Lam, K.P., R. Kuhn, and K. Rajewsky. 1997. In vivo ablation of surface immunoglobulin on mature B cells by inducible gene targeting results in rapid cell death. Cell. 90:1073–1083. [DOI] [PubMed] [Google Scholar]
- 48.Di Fiore, P.P., and P. De Camilli. 2001. Endocytosis and signaling: an inseparable partnership. Cell. 106:1–4. [DOI] [PubMed] [Google Scholar]


