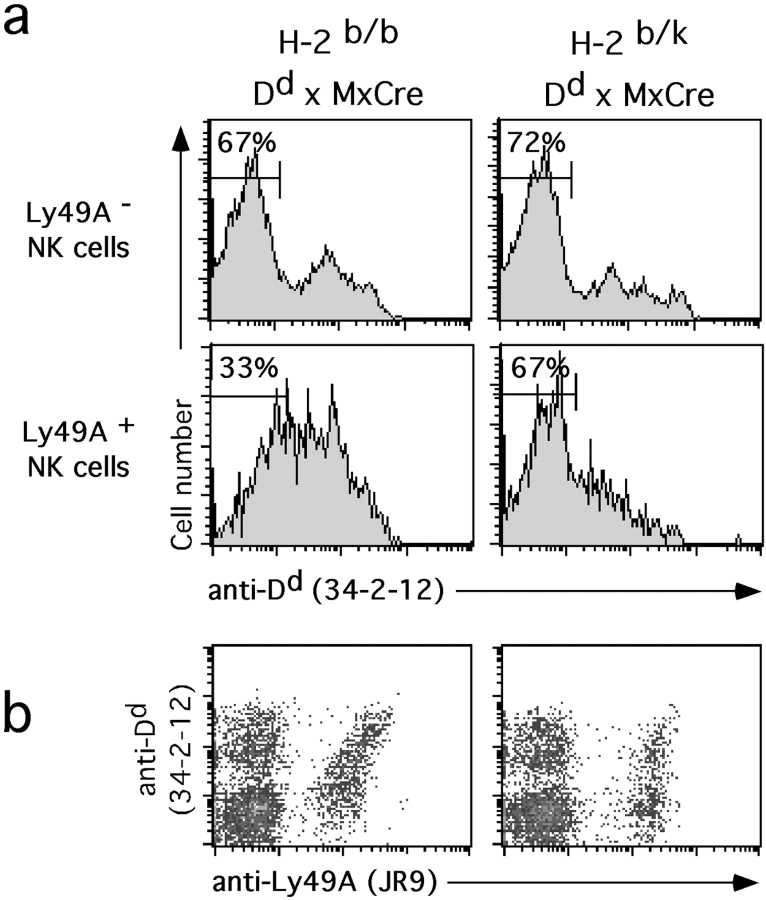
Figure 6.
H-2k expression prevents Dd uptake in vivo. Splenocytes from H-2b/b Dd × MxCre and H-2b/k Dd × MxCre double Tg mice were stained with mAbs to Ly49A, NK1.1, CD3, and Dd and analyzed by four color flow cytometry. (a) Histograms show Dd expression on Ly49A− (top) and Ly49A+ (bottom) NK cells (NK1.1+CD3−) of the two types of mice. Numbers in histograms indicate the percentages of NK cells with low Dd expression. (b) Density plots show expression of Ly49A versus Dd on gated NK cells (NK1.1+CD3−) from the two types of mice.

