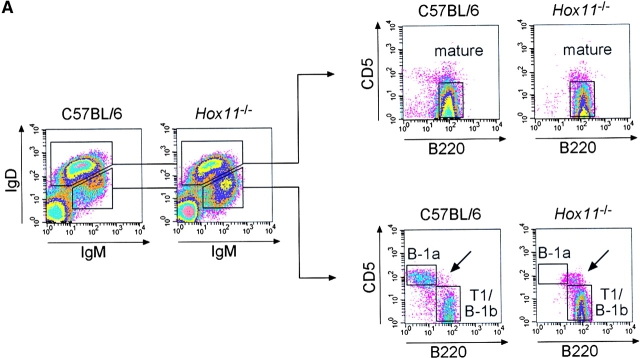
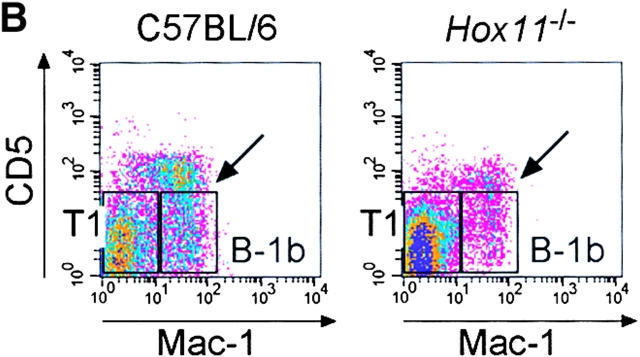
Figure 2.
B-1a cells are absent in the blood of asplenic mice. (A) Representative flow cytometric analysis of peripheral blood cells isolated from C57BL/6 and Hox11-null mice. Cells were stained with antibodies against IgM, IgD, CD5, and B220. IgMdullIgDpos (left panels, top region) and IgMposIgDdull B lymphocytes (left panels, bottom region) were gated and analyzed for B220 versus CD5 expression (right panels). IgMdullIgDpos cells are B220posCD5neg mature B lymphocytes (top right panels). Gated IgMposIgDdull B lymphocytes (bottom right panels) comprise CD5posB220dull B-1a cells (top region) and CD5negB220pos B-1b and T1 cells (bottom region). The CD5posB220pos B-1a population that remains in Hox11-null mice is indicated with an arrow. (B) Representative flow cytometric analysis of cells stained with antibodies against IgM, IgD, CD5, and Mac-1 isolated from blood of the same C57BL/6 and Hox11-null mice analyzed in A. IgMposIgDdull B-lymphocytes were gated and analyzed for Mac-1 versus CD5 expression. Gated IgMposIgDdull B lymphocytes comprise CD5posMac-1pos B-1a cells (indicated by arrow), CD5negMac-1pos B-1b, and CD5negMac-1neg T1 cells. (C) Relative proportions of the major B cell populations in the peripheral blood of C57BL/6 and Hox11-null mice. Each value is the average of measurements obtained in five mice. For the purpose of measurement, B-1a cells are defined as IgMposIgDdullB220dullCD5pos, B-1b as IgMposIgDdullMac-1posCD5neg, and T1 as IgMposIgDdullMac-1negCD5neg. IgMposIgDdull cells constituted 26.5% ± 5.7% of total B cells (IgMpos and/or IgDpos) in the blood of C57BL/6 and 39.5% ± 6.5% in Hox11-null mice.


