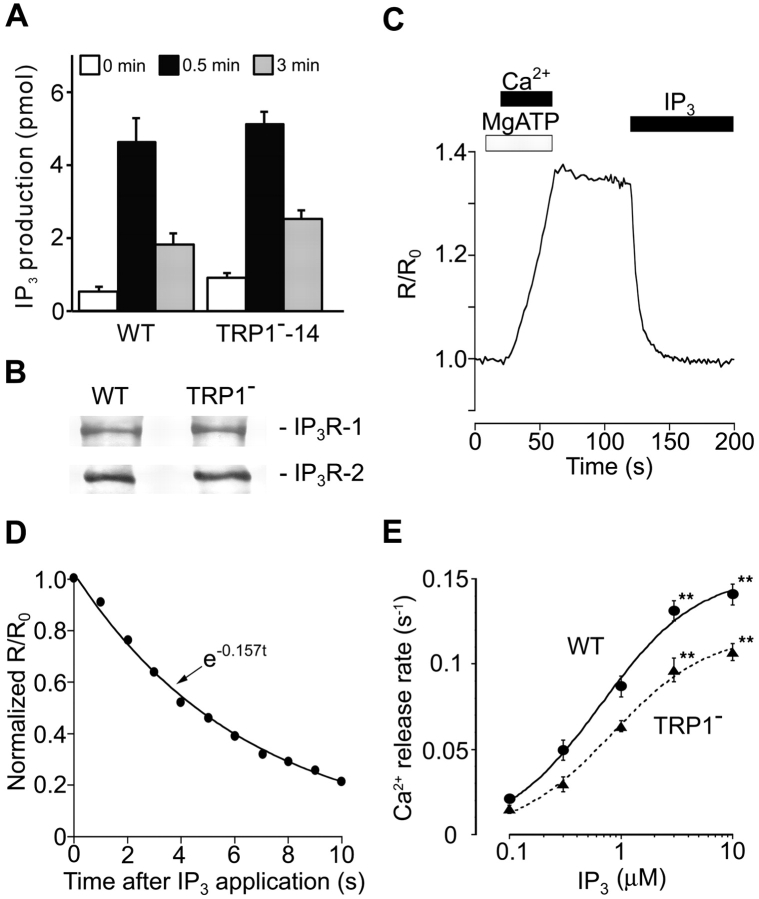
Figure 3.
IP3-induced Ca2+ release is suppressed in TRP1-deficient cells. (A) Intact BCR-induced IP3 production in TRP1-deficient cells. Cells were stimulated with anti-BCR antibody M4 (1 μg/ml) for the indicated time. Data points are the mean ±SE from four experiments. (B) Western blot analysis demonstrating the IP3R-1 or IP3R-2 expression indistinguishable in WT and mutant cells using a polyclonal antibody against either IP3R-1 or IP3R-2. (C) The ER luminal Ca2+ concentration increased with activation of the Ca2+ pump, and declined upon application of IP3. (D) The level of activation of the IP3R can be quantitatively compared by the initial rate of Ca2+ release, which we estimated by fitting an exponential curve (continuous line) to the initial part of the Ca2+ decay signal (black circles). (E) IP3-concentration dependence of Ca2+ release. Release rates were obtained by fitting a single exponential to the initial part of Ca2+ decay signal measured in luminal Ca2+ monitoring (reference 27). The continuous curve and dotted curve represent the best fit hyperbolic equations, rmax/(1 + EC50/[IP3]), where rmax is the extrapolated values of the maximal rate of Ca2+ release, for Ca2+ release rates in WT and TRP1-deficient cells, respectively. rmax and EC50 were 0.153 s-1 and 0.66 μM in WT cells, and 0.118 s−1 and 0.83 μM in mutant cells. Data obtained from TRP1−-14 and TRP1−-16 were combined. Data points are the mean ±SE from six to seven experiments. **P < 0.01.

