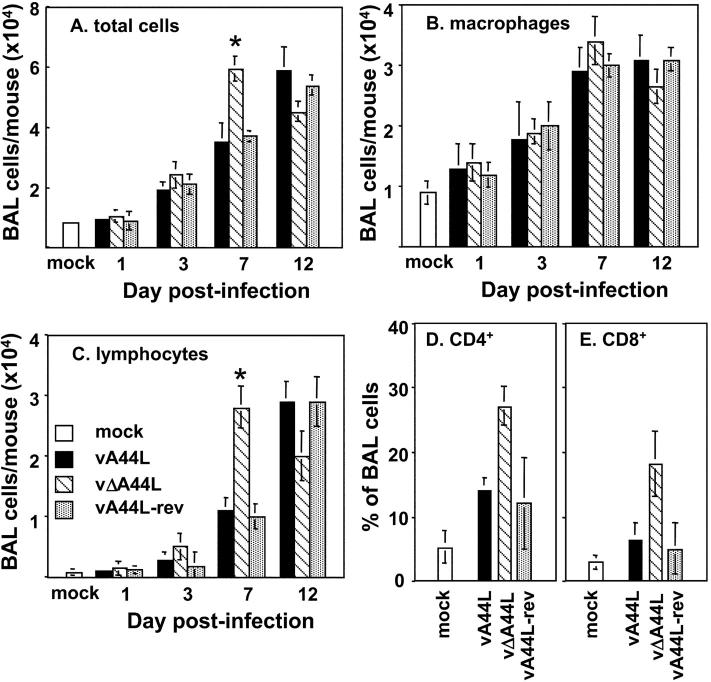
Figure 4.
Characterization of BAL cell suspensions from mice infected with 104 PFU of vA44L, vΔA44L, or vA44L-rev. BAL cells were recovered, counted, and stained to determine the numbers of (A) total cells, (B) macrophages, and (C) lymphocytes from mock-infected and VV-infected mice. Columns represent the mean cell yield per mouse ± SEM from groups of 4–5 mice. Columns marked with an asterisk represent mean cell numbers recovered from vΔA44L-infected mice that were significantly different (*, P < 0.05) to those of both vA44L and vA44L-rev-infected mice. (D and E) At 7 d pi, BAL cells were recovered, stained for expression of CD3, CD4, and CD8 and analyzed by flow cytometry. Lymphocytes were identified by their characteristic FSC/SSC profile and by expression of CD3. Data shown are the mean percentage of BAL cells ± SEM from 4–5 individual mice, and are representative of two independent experiments.

