
Figure 2.
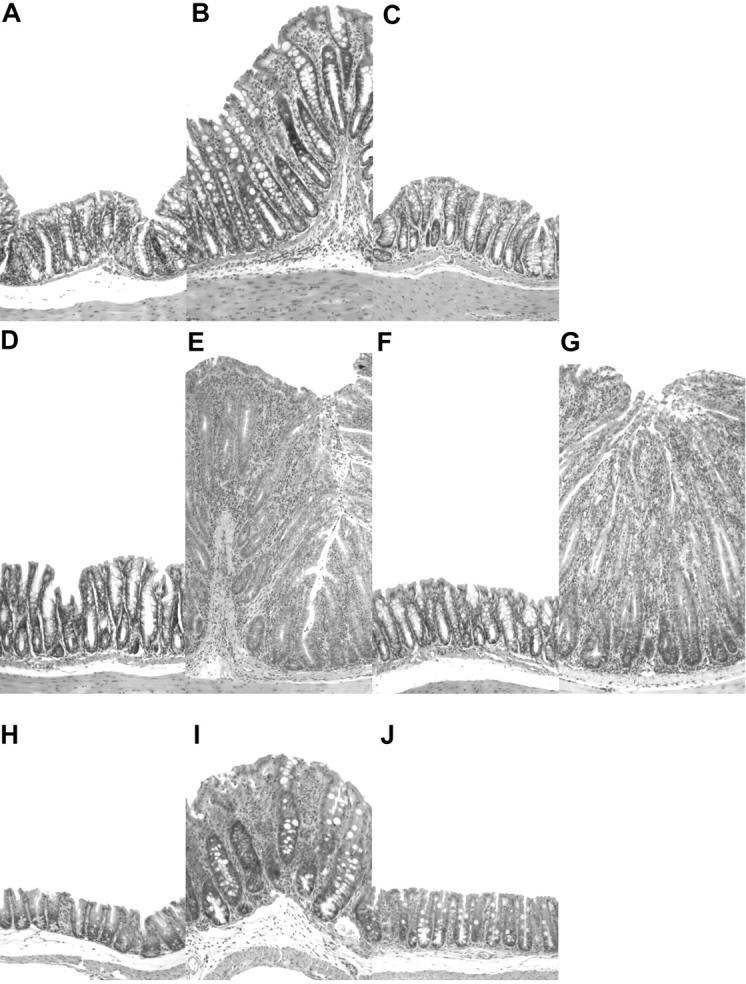
Representative photomicrographs of hematoxylin and eosin stained intestinal tissues from 129SvEvRAG2−/− mice that were reconstituted with purified CD4+ T cell subsets and/or infected with H. hepaticus as outlined in Fig. 1. (A–G) Colon sections from a control RAG2−/− mouse (A) and from mice that received; H. hepaticus only (B), H. hepaticus and CD4+CD45RBlowCD25+ T cells (C), CD4+CD45RBhigh T cells only (D), CD4+CD45RBhigh T cells and H. hepaticus (E), CD45RBhighCD4+ T cells plus CD4+CD45RBlowCD25+ T cells and H. hepaticus (F), or CD45RBhighCD4+ T cells plus CD4+CD45RBlowCD25− T cells and H. hepaticus (G). (H–J) Cecum sections from a control RAG2−/− mouse (H) and from mice that received; H. hepaticus only (I), or H. hepaticus and CD4+CD45RBlowCD25+ T cells (J). Original magnification: ×50.