Figure 5.
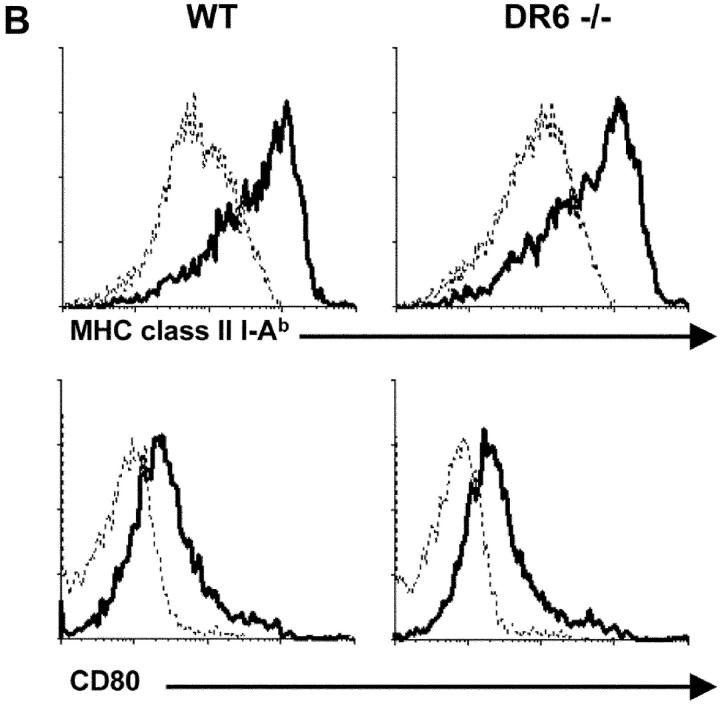
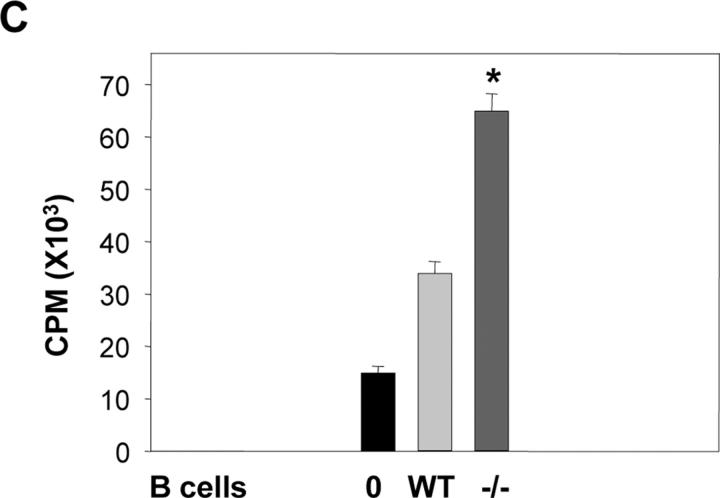
Enhanced expression of CD86 and APC function by activated DR6−/− B cells. (A) B220+ cells from DR6−/− or WT mice were stimulated with 20 μg/ml anti-IgM, 10 μg/ml anti-CD40, or 5 μg/ml LPS for 24 h and analyzed by flow cytometry for CD86 surface expression. Solid line histograms represent CD86 staining of activated cells and dashed line histograms represent unstimulated levels. (B) As in A but LPS-stimulated B cell cultures were analyzed for surface expression of MHC class II I-Ab (top) and CD80 (bottom). Y axis represents relative cell number and x axis represents log10 fluorescence intensity. (C) For allogeneic T cell proliferation assay, responding T cells (H-2d) were purified from BALB/c mice and cultured in the presence or absence of irradiated WT or DR6-deficient (−/−) B cells that were previously stimulated with 10 μg/ml anti-CD40 for 24 h and then irradiated. After 5 d of incubation, the proliferation of allogeneic T cells was measured by [3H]thymidine incorporation in the last 6 h of pulse. Values shown represent the mean and error bars represent the SD. *, P < 0.01. Data shown are representative of three independent experiments.


