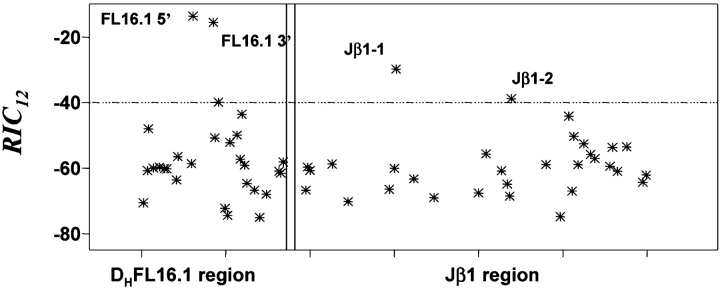
Figure 3.
RIC 12 values for 28-bp segments from genomic regions containing DHFL16.1 or Jβ1-1 and Jβ1-2. RIC 12 are given on the y axis, and position in the sequence is shown on the x axis. RIC 12 values from the DHFL16.1 region are shown in the left panel, and those from the Jβ region are shown in the right panel. Each point represents the RIC 12 for the 28-bp segment beginning at that position.

