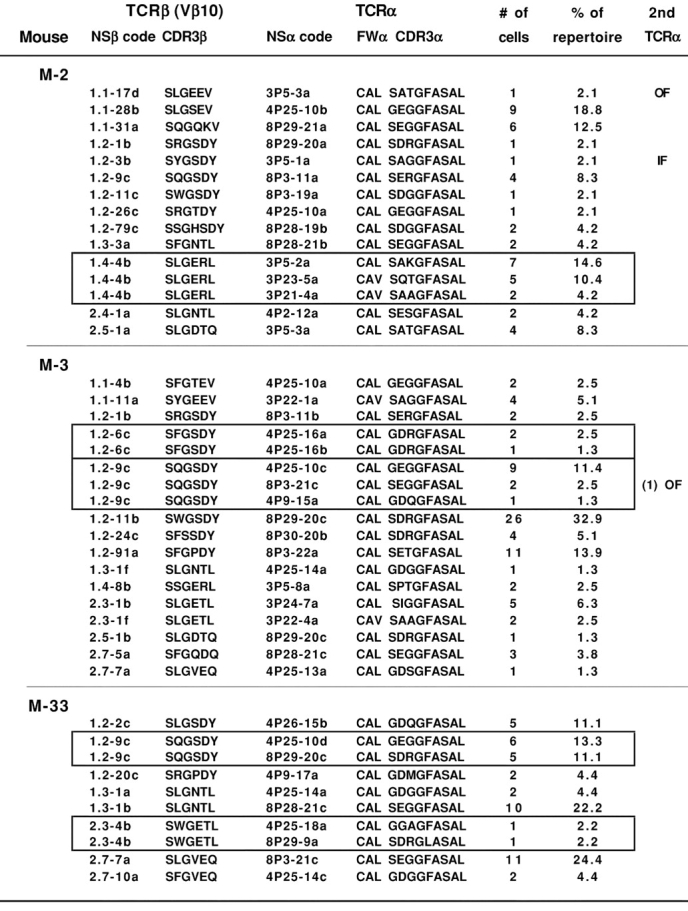
Figure 2.

Single cell RT-PCR analysis reveals clusters of CW3-specific clones expressing β chains encoded by identical VDJ-β nucleotide sequences paired with different TCR-α chains. The cDNA from tubes containing single CW3-specific CD8 T cells sorted from PBL of M-2 and M-3 or M-33 was subjected to RT-PCR, and PCR products were sequenced and assigned a TCR sequence code (NS). The complete analysis is shown in Figs. S1, S2, and S3, available at http://www.jem.org/cgi/content/full/jem.20021945/DC1. Represented here are those cells for which both a CW3-like Vβ10 sequence and a CW3-like Vα3, Vα4, or Vα8 sequence were amplified. The deduced aa sequences of the TCR junctions are shown. All TCR-α sequences incorporate the Jα35 sequence. Also shown are the number (#) of cells found for each αβ TCR clone and its corresponding percentage (%) within the αβ TCR repertoire defined here for each mouse. Each cluster of αβ TCR clones sharing an identical Vβ10 TCR nucleotide sequence is framed. Cells for which an in-frame (IF) or out of frame (OF) second TCR-α rearrangement was also amplified are indicated.
