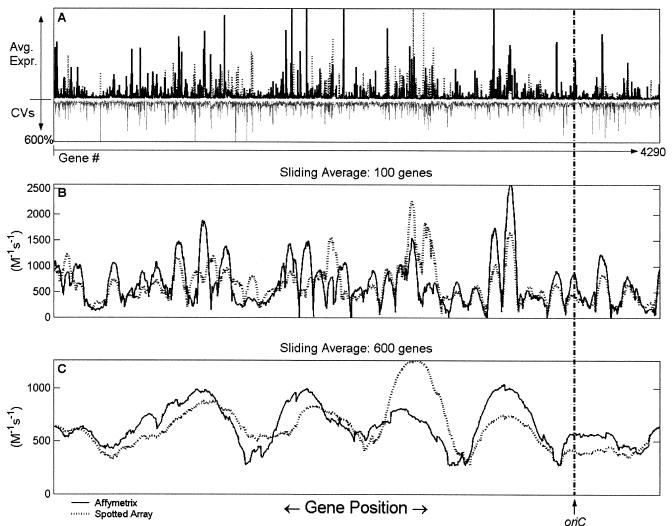
FIG. 1.
Calculated average effective promoter strengths at different sliding average scales. The cellular parameters were chosen for a doubling time of 40 min (see Table 1), with an RNAP concentration of 1.456 × 10⁻⁶ M (8). The concentration of each promoter was chosen based on a C period of 45 min and a D period of 25 min (8), where the C period refers to the time between initiation and completion of one round of chromosomal replication, and the D period refers to the interval between the end of replication and cell division (22). The location of the origin of replication (oriC) is indicated for reference. (A) Plots of mean expression levels and CVs for the 20 Affymetrix data sets and the 29 spotted array data sets. The solid bars represent the mean effective promoter strengths calculated from experiments performed with Affymetrix arrays, the dotted bars represent the effective promoter strengths calculated from spotted array experiments; and the grey bars represent the CVs spanning all 49 data sets used in the calculations. (B) Plot of mean expression levels over a sliding average (with second-order Savitzky-Golay smoothing) of 100 genes for the Affymetrix array (solid line) and the spotted array (dotted line) data sets. (C) Same as panel B, but the sliding average was taken over a 600-gene window.

