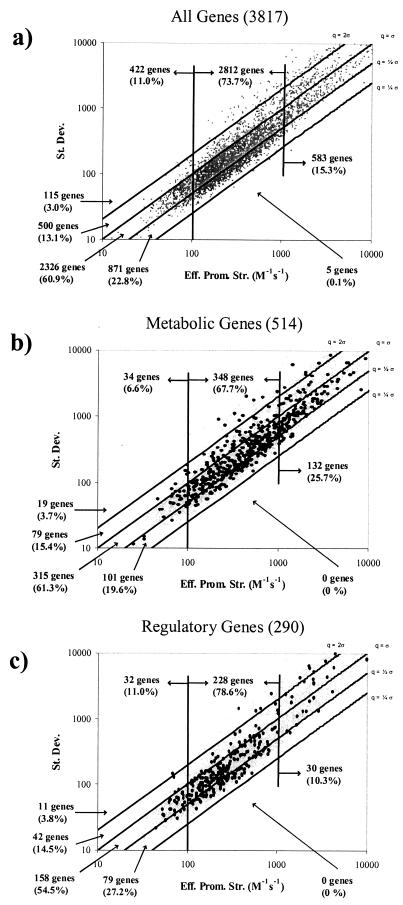
FIG.2.
Log-log plots of the standard deviations (St. Dev.) versus mean effective promoter strengths (Eff. Prom. Str.) for individual ORFs in 49 expression data sets. The gene information outside each plot indicates the numbers of genes between CV demarcations, and the gene information inside each plot indicates the numbers of genes whose promoter strengths were less than 100 M−1 s−1, between 100 and 1,000 M−1 s−1, and greater than 1,000 M−1 s−1. (a) Plot of all 3,817 genes for which effective promoter strengths were calculated. (b) Overlay of 514 metabolic genes (12). (c) Overlay of 290 regulatory genes (34).

