FIG. 3.
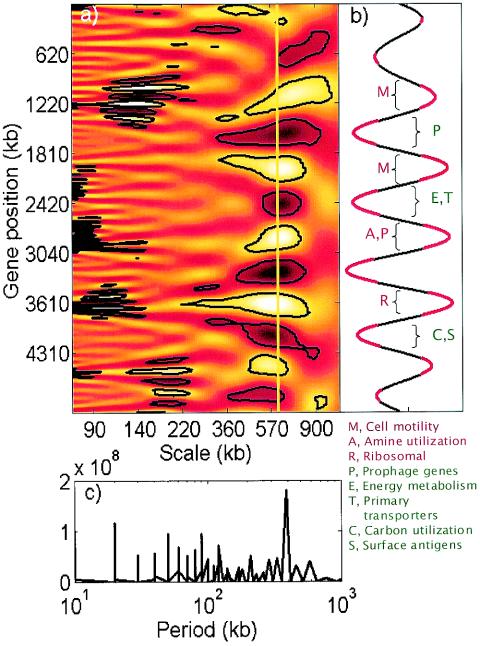
Spatial variability of gene expression along the E. coli genome studied by using continuous wavelet and Fourier transforms of the effective promoter strength data. (a) Scalogram of the wavelet transform with the gene position on the y axis and the transform scale on the x axis. Lighter and darker regions correspond to higher and lower values of the coefficients, respectively. The regions enclosed by black contour lines were deemed to be statistically significant patterns compared to spatially randomized effective promoter strengths (P < 0.001). (b) Cross section of the wavelet scalogram in panel A at a scale of 610 kb. The regions with significantly nonrandom wavelet coefficients are indicated by red. Gene functional classes (classified according to GenProtEC 38) preferentially located in particular high-expression (red) or low-expression (green) regions (hypergeometric P < [0.001/number of functional classes]) are also indicated. (c) Fourier transform analysis of the effective promoter strength data. The only significant peak in the transform occurs at the approximately 600-kb period.

