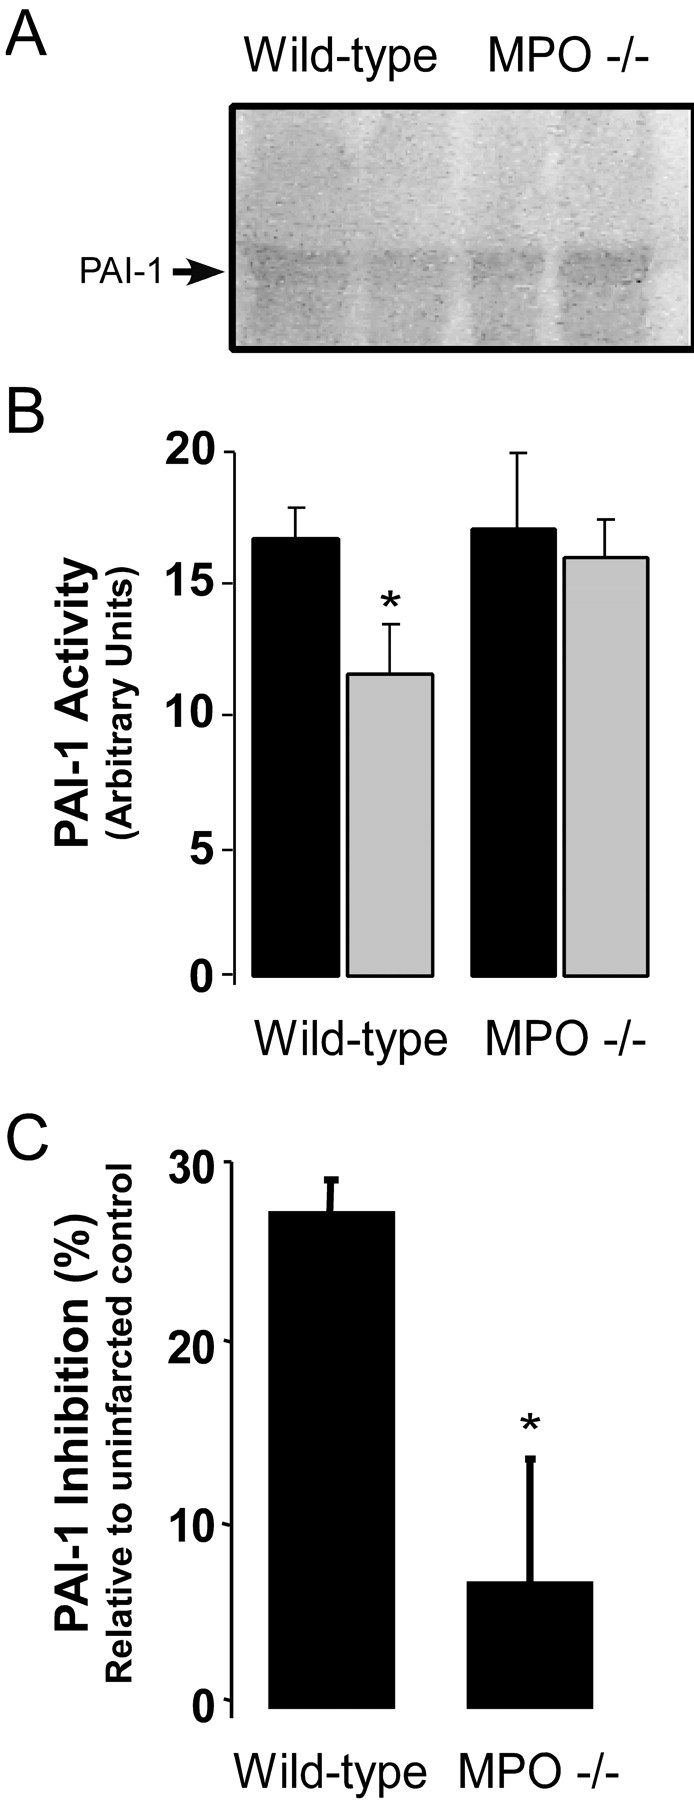
Figure 5.

PAI-1 activity 1 d after AMI in WT and MPO−/−. (A) Representative reverse casein zymograms for PAI-1 activity in protein extracts from the infarct zones of two representative WT and two MPO−/− mice with no MI (filled bars) or one representative MPO−/−. (B) PAI-1 activity in WT and MPO−/− 1 d after AMI (open bars) as quantified in arbitrary units from reverse zymograms (n = 4 animals per group per time point). *, P < 0.02, WT versus MPO−/− 1 d after AMI. (C) Inhibition of PAI-1 activity (%) in the infarct zone relative to PAI-1 activity in strain-matched non-infarcted tissue as measured by two-stage indirect plasmin-based assay for PAI-1 in WT (n = 6) and MPO−/− (n = 6) myocardium 1 d after LAD ligation. Data represent mean ± SD. *, P < 0.01.
