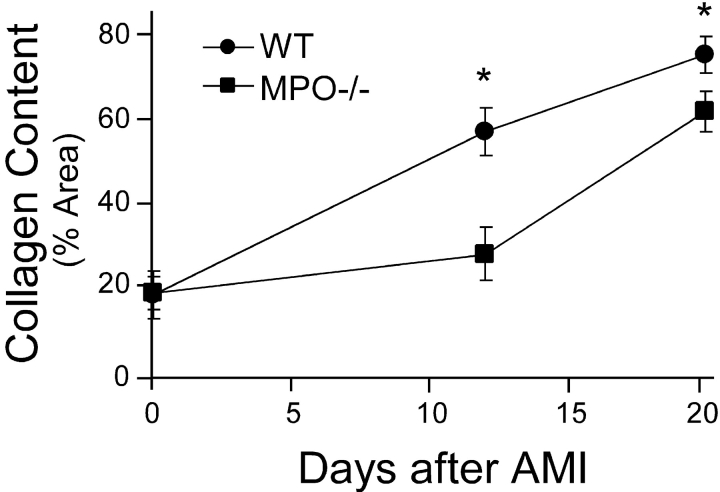
Figure 6.
Collagen content in the infarct zone was quantified as the percent area that was birefringent under illumination with polarized light after staining with picrosirius red. Collagen content was quantified from five areas within the infarct zone from three frozen sections in three animals per time point in both the WT and MPO−/−. Data represents mean ± SD. *, P < 0.02, WT versus MPO at given time point.

