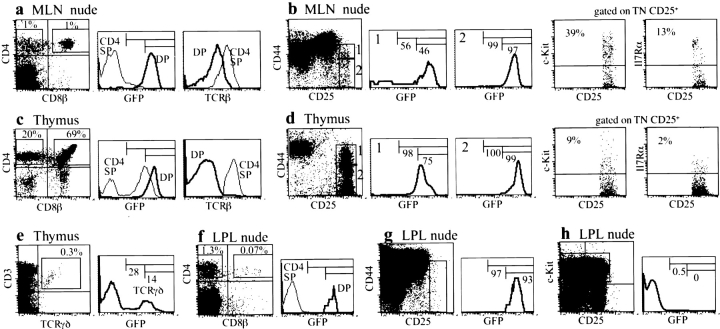
Figure 2.
Analysis of GFP expression during T lymphopoiesis in athymic mice and thymopoiesis. (a–d) MLN (a and b) and thymus (c and d). (a and c) Comparative features of DP and SP cells analyzed for GFP (middle histograms) and TCRβ (right histograms) expressions. Note that DP cells express less TCRβ chains than SP and that there is a small difference between thymus and MLN DP cells in this respect. (b and d) TN CD25H cells (after gating out CD3+, CD4+, CD8+, and CD19+ cells) analyzed for GFP content of CD44+ DN2 (middle histograms) and CD44− DN3 cells (right histograms). All other TN cells were GFP− and most of the MLN CD25L cells had the phenotype of cryptopatch cells (reference 8). Lack or rarity of DN4 cells (CD44− CD25−) results from gating out CD3 and coreceptors bearing cells with potent antibodies binding even cells with trace amounts of these molecules, as is the case of most DN4 cells. The percentages of c-Kit+ and IL7-Rα+ in CD25+ TN MLN cells and thymocytes are shown in the right panels. (e) Thymus: γδ+ cells analyzed for GFP content. (f–h) LP lymphocytes analyzed for GFP content. (f) DP cells are GFPH and (g) TN CD25H cells (after gating out of cells as described above) are GFPH. (h) TN c-Kit+ CD25+/− cells, belonging to a population of CD44+ Thy-1+/− IL7-R+ CD4+/− cells (not depicted), i.e., with the phenotype of cryptopatch cells (references 8 and 20), are GFP−.

