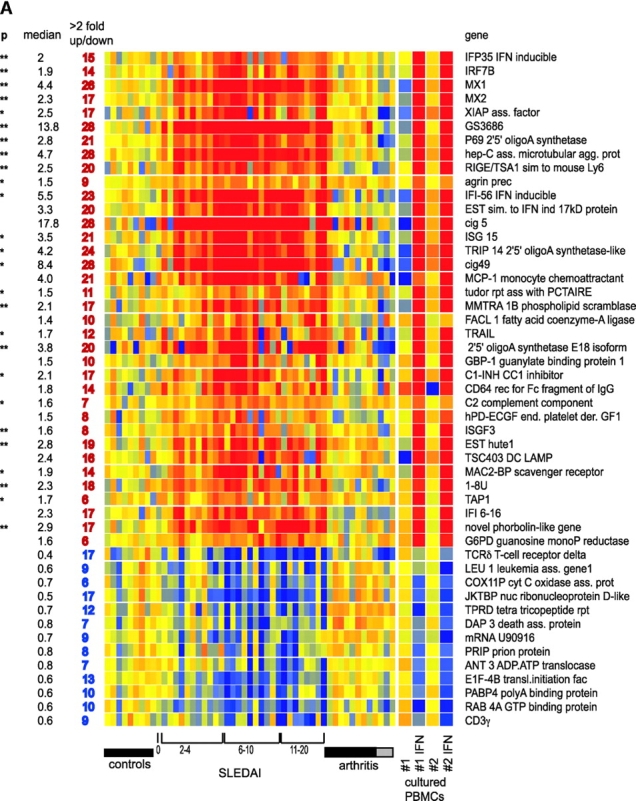
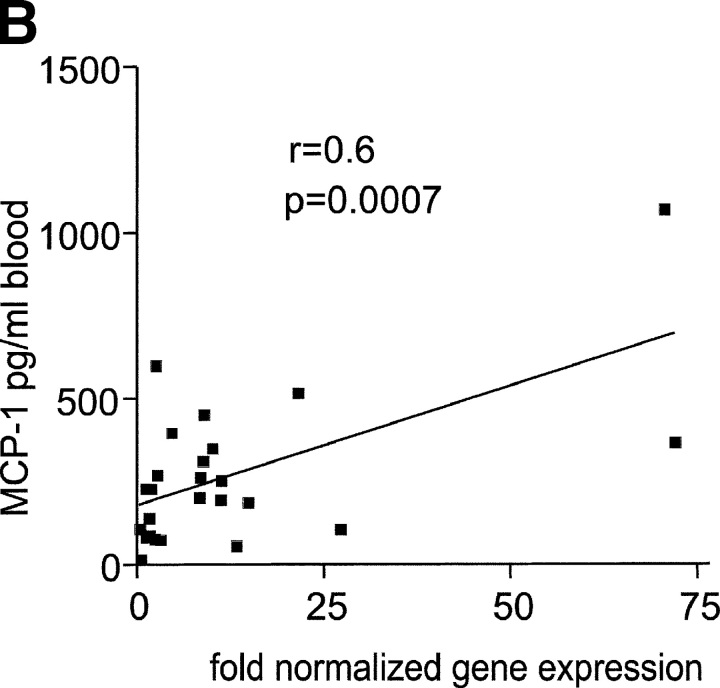
Figure 2.

IFN signature. (A) Active SLE patients leukocytes (left panel) display 36 IFN-up-regulated and 13 down-regulated transcript sequences. The same genes are altered in healthy PBMCs cultured in vitro with IFN-α (right panel). Median expression and the number of patients who display more than twofold increase in gene expression. ** Significant after Bonferroni correction, * significant after Benjamini and Hochberg correction. (B) Levels of MCP-1 protein in the 25 available SLE serum samples correlate with the MCP-1 gene expression.

