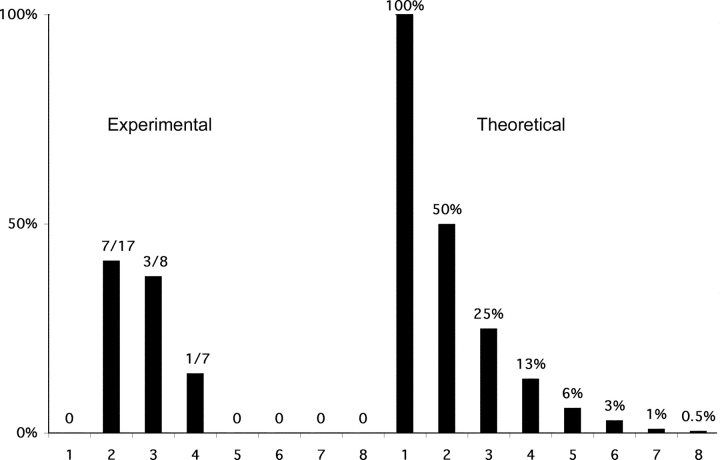
Figure 4.
Graph of κ germline transcription in pre-B cells. Left panel: the percentage of cells appearing to be monoallelic is plotted as a function of the number of positive PCR reactions observed per cell. 16 cells revealed one PCR product/cell, 17 cells revealed two, 8 cells revealed three, 7 cells revealed four, 2 cells revealed five, six and seven PCR product/cell, and 3 cells revealed eight PCR products/cell. Note that grouping either the cells with 2 or 3 products per cell or the cells with 4 or more products per cell gives a fraction of the cells appearing monoallelic which is slightly below and statistically indistinguishable from the theoretical prediction for a biallelically expressed gene. Right panel: the theoretical expectation for an analysis of a monoallelically expressed gene. The formula 2/2n (where n is the number of PCR products observed) approximates the fractions for low values of n. The percentages presented leave out a minor correction in the formula for rare instances in which a given signal actually represents more than one cDNA product. The line across at the 100% level indicates what would be theoretically expected if monoallelic expression were absolute.

