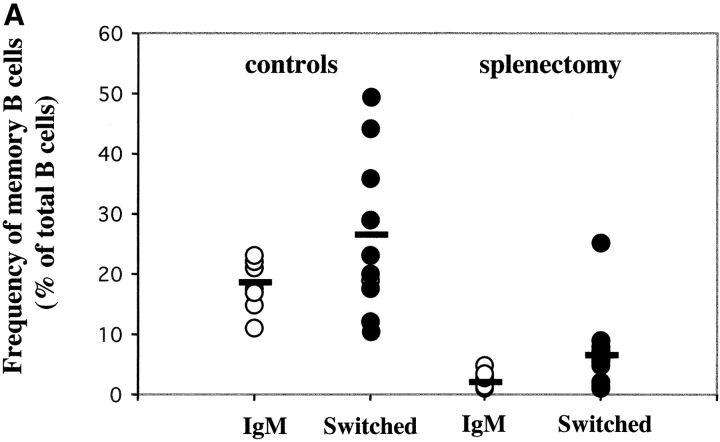
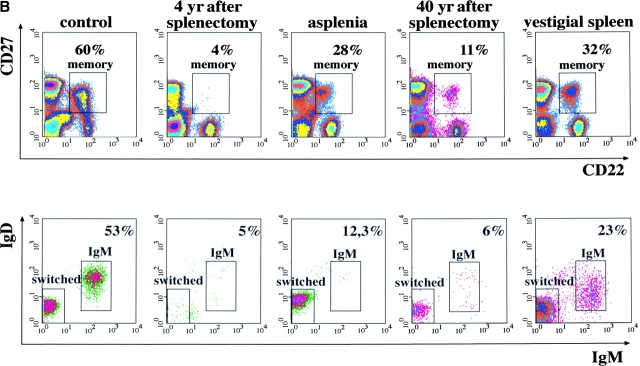
Figure 2.
(A) Frequency of IgM and switched memory B cells in 11 controls and 14 splenectomized patients. (B) PBLs from the indicated subjects were stained and analyzed as described in Fig. 1 A. On the top, the expression of CD22 and CD27 is shown. The numbers indicate the frequency of memory B cells, calculated as a percentage of CD22+ B cells. On the bottom, IgM and switched memory B cells were identified as described in Fig. 1 A.


