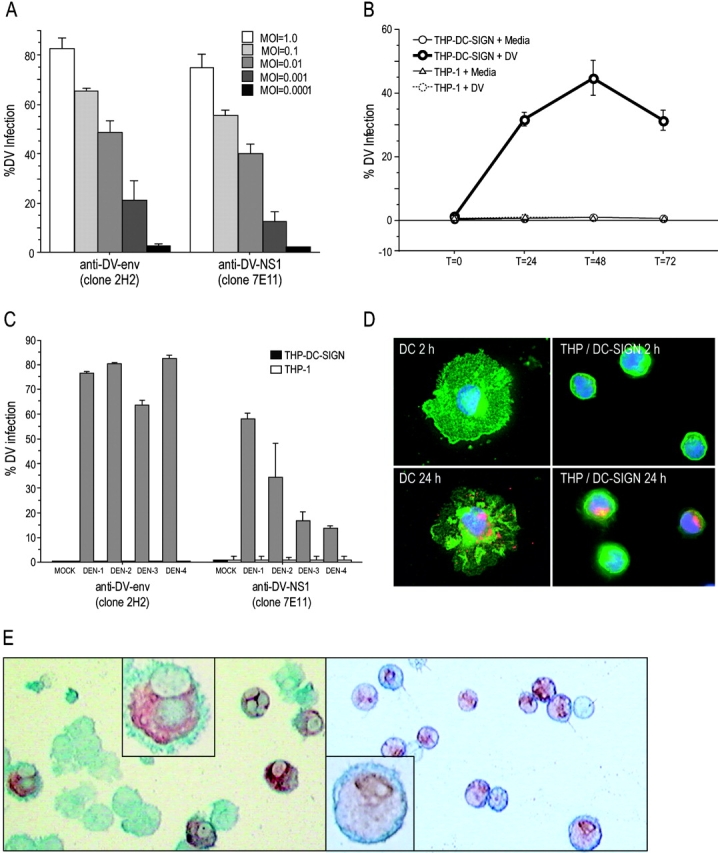
Figure 2.

Dose and time dependence of DV infection in THP DC-SIGN cells. (A) Titration of DV2 infection in THP DC-SIGN and THP-1 2 d after infection. The infected cells were stained for DV envelope antigen (clone 2H2) and the NS1 (clone 7E11) and infection was determined by calculating the percentage of fluorescence-positive cells. (B) Kinetics of DV2 infection in THP DC-SIGN and THP-1. The infected cells were harvested at t = 0, 24, 48, and 72 h and stained with 2H2 and 7E11. (C) DV infection rates of all four DV serotypes in THP DC-SIGN and THP-1, using DV 1, 2, 3, and 4. Data are averages of two independent experiments. (D) Representative immunofluorescence experiment at two time points (2 h, top, and 24 h, bottom) showing bound DV envelope complex antigens (red) in DC-SIGN (green)–bearing DC (left) and THP-DC-SIGN (right) cells. Nuclei were labeled with DAPI stain. (E) Representative immunohistochemistry experiment showing bound intracellular DV envelope complex antigens (dark red) in DC-SIGN–bearing cells (blue). The left (immature DC) and right panels (THP DC-SIGN) show cells infected with DV. Original magnifications at 200 (insets, 600).
